'data.frame':   506 obs. of  16 variables:
 $ lon    : num  -71 -71 -70.9 -70.9 -70.9 ...
 $ lat    : num  42.3 42.3 42.3 42.3 42.3 ...
 $ cmedv  : num  24 21.6 34.7 33.4 36.2 28.7 22.9 22.1 16.5 18.9 ...
 $ crim   : num  0.00632 0.02731 0.02729 0.03237 0.06905 ...
 $ zn     : num  18 0 0 0 0 0 12.5 12.5 12.5 12.5 ...
 $ indus  : num  2.31 7.07 7.07 2.18 2.18 2.18 7.87 7.87 7.87 7.87 ...
 $ chas   : Factor w/ 2 levels "0","1": 1 1 1 1 1 1 1 1 1 1 ...
 $ nox    : num  0.538 0.469 0.469 0.458 0.458 0.458 0.524 0.524 0.524 0.524 ...
 $ rm     : num  6.58 6.42 7.18 7 7.15 ...
 $ age    : num  65.2 78.9 61.1 45.8 54.2 58.7 66.6 96.1 100 85.9 ...
 $ dis    : num  4.09 4.97 4.97 6.06 6.06 ...
 $ rad    : int  1 2 2 3 3 3 5 5 5 5 ...
 $ tax    : int  296 242 242 222 222 222 311 311 311 311 ...
 $ ptratio: num  15.3 17.8 17.8 18.7 18.7 18.7 15.2 15.2 15.2 15.2 ...
 $ b      : num  397 397 393 395 397 ...
$ lstat : num 4.98 9.14 4.03 2.94 5.33 ...Explanation Groves
Analyzing the Trade-off between Complexity and Adequacy of Machine Learning Model Explanations
13-05-2025
Machine Learning
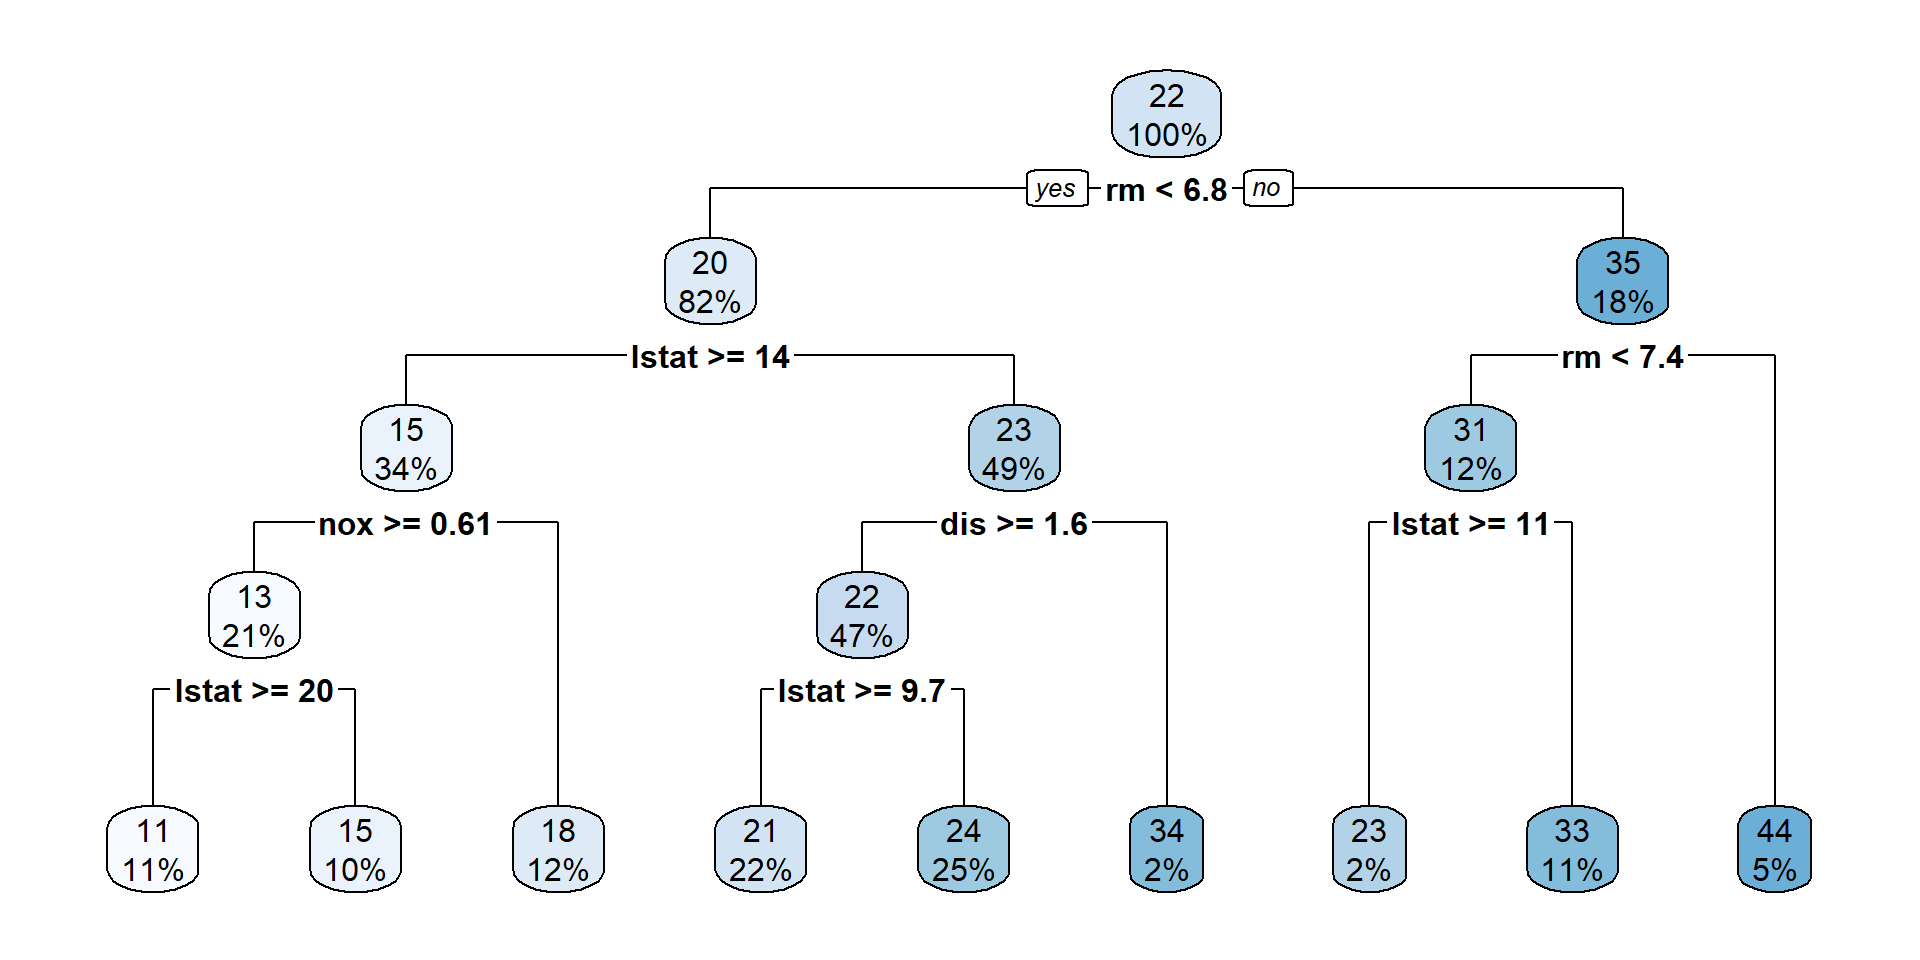
Interpretation Tree Model…
Background
- European Commission (2024): EU AI Act
- Bücker et al. (2021): TAX4CS framework
- Molnar et al. (2022): pitfalls
- Gosiewska and Biecek (2019): additivity
- Woźnica et al. (2021): importance of context
- Rudin (2019): use interpretable models instead
- Szepannek and Lübke (2022): analyzing limits of interpretability
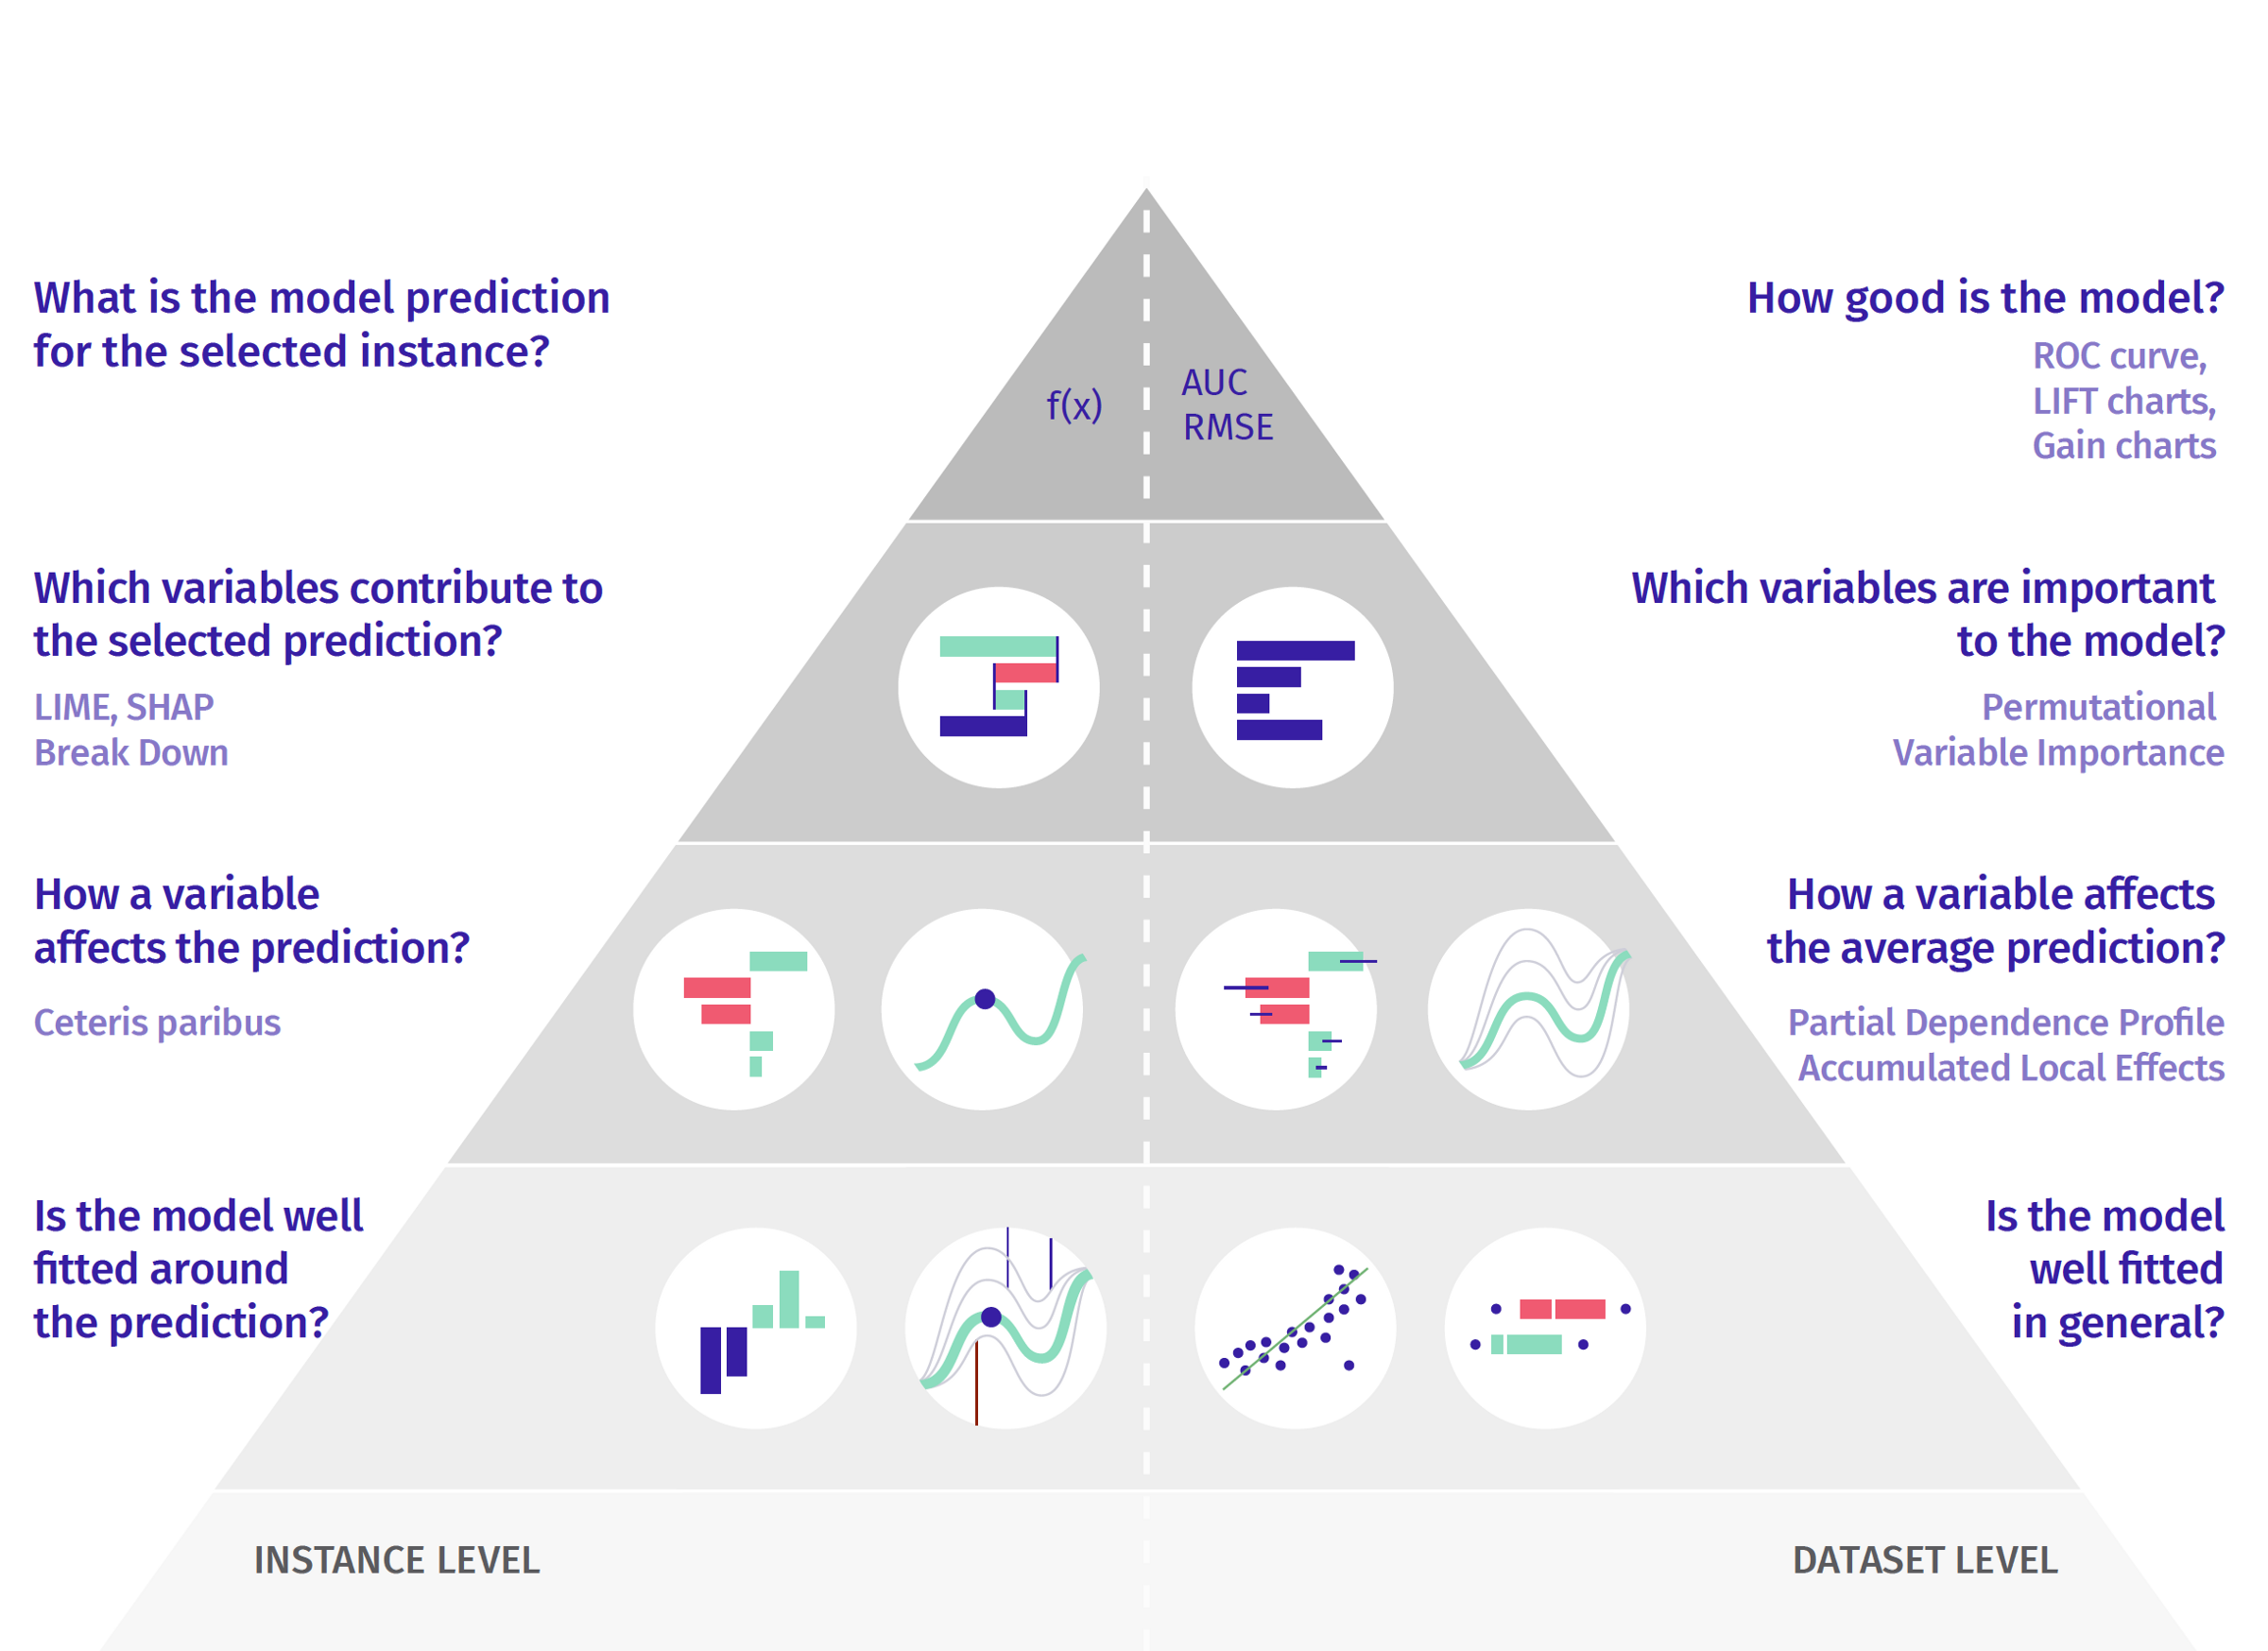
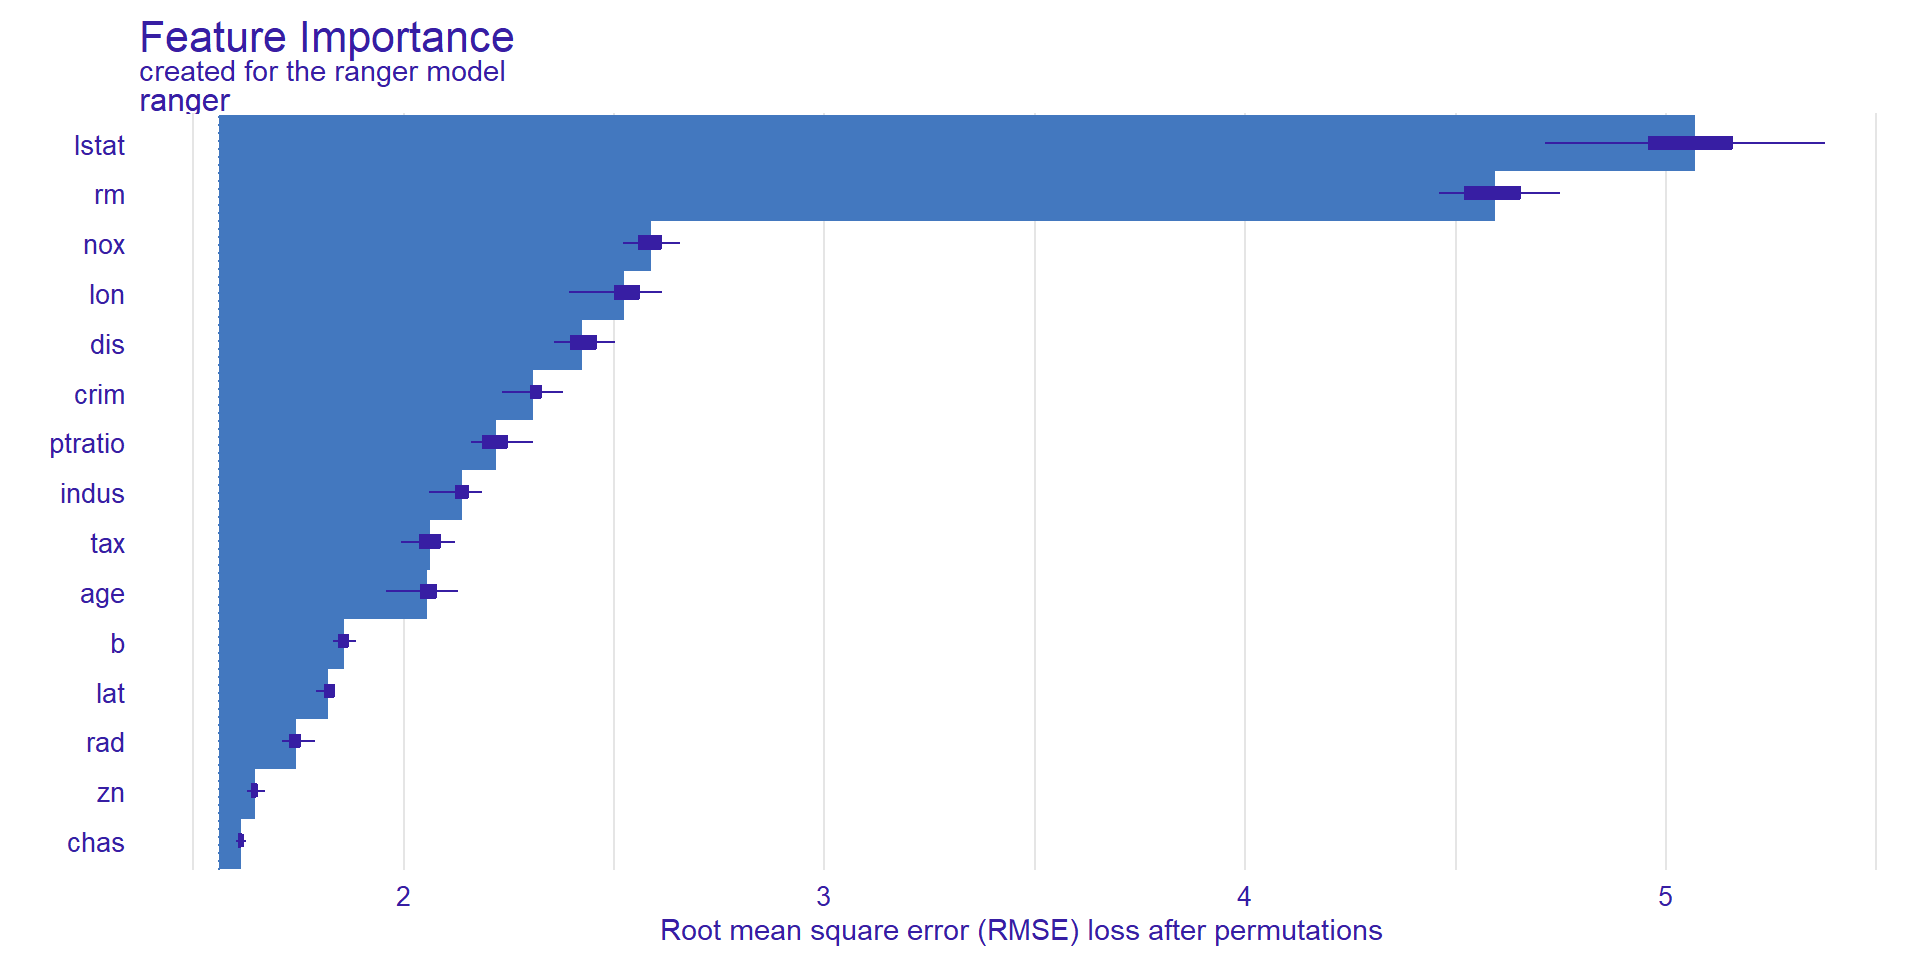
Variable Importance
Partial dependence
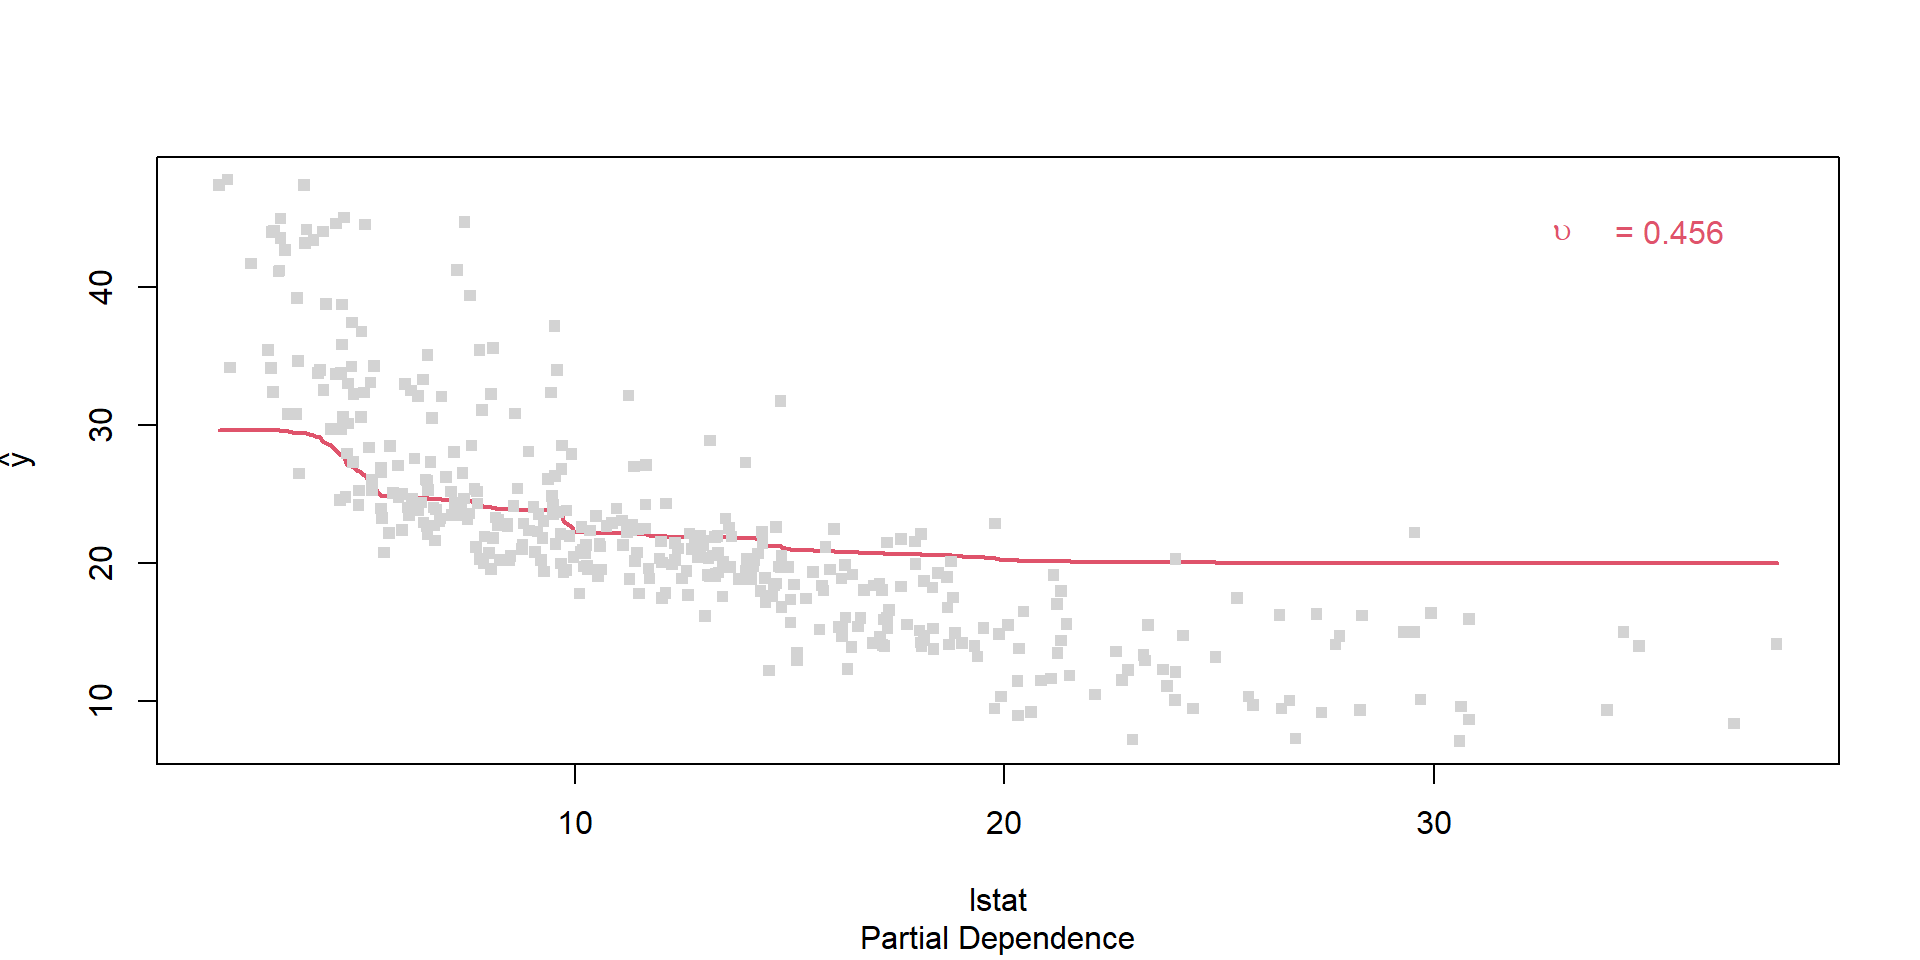
Explainability of MRTs…
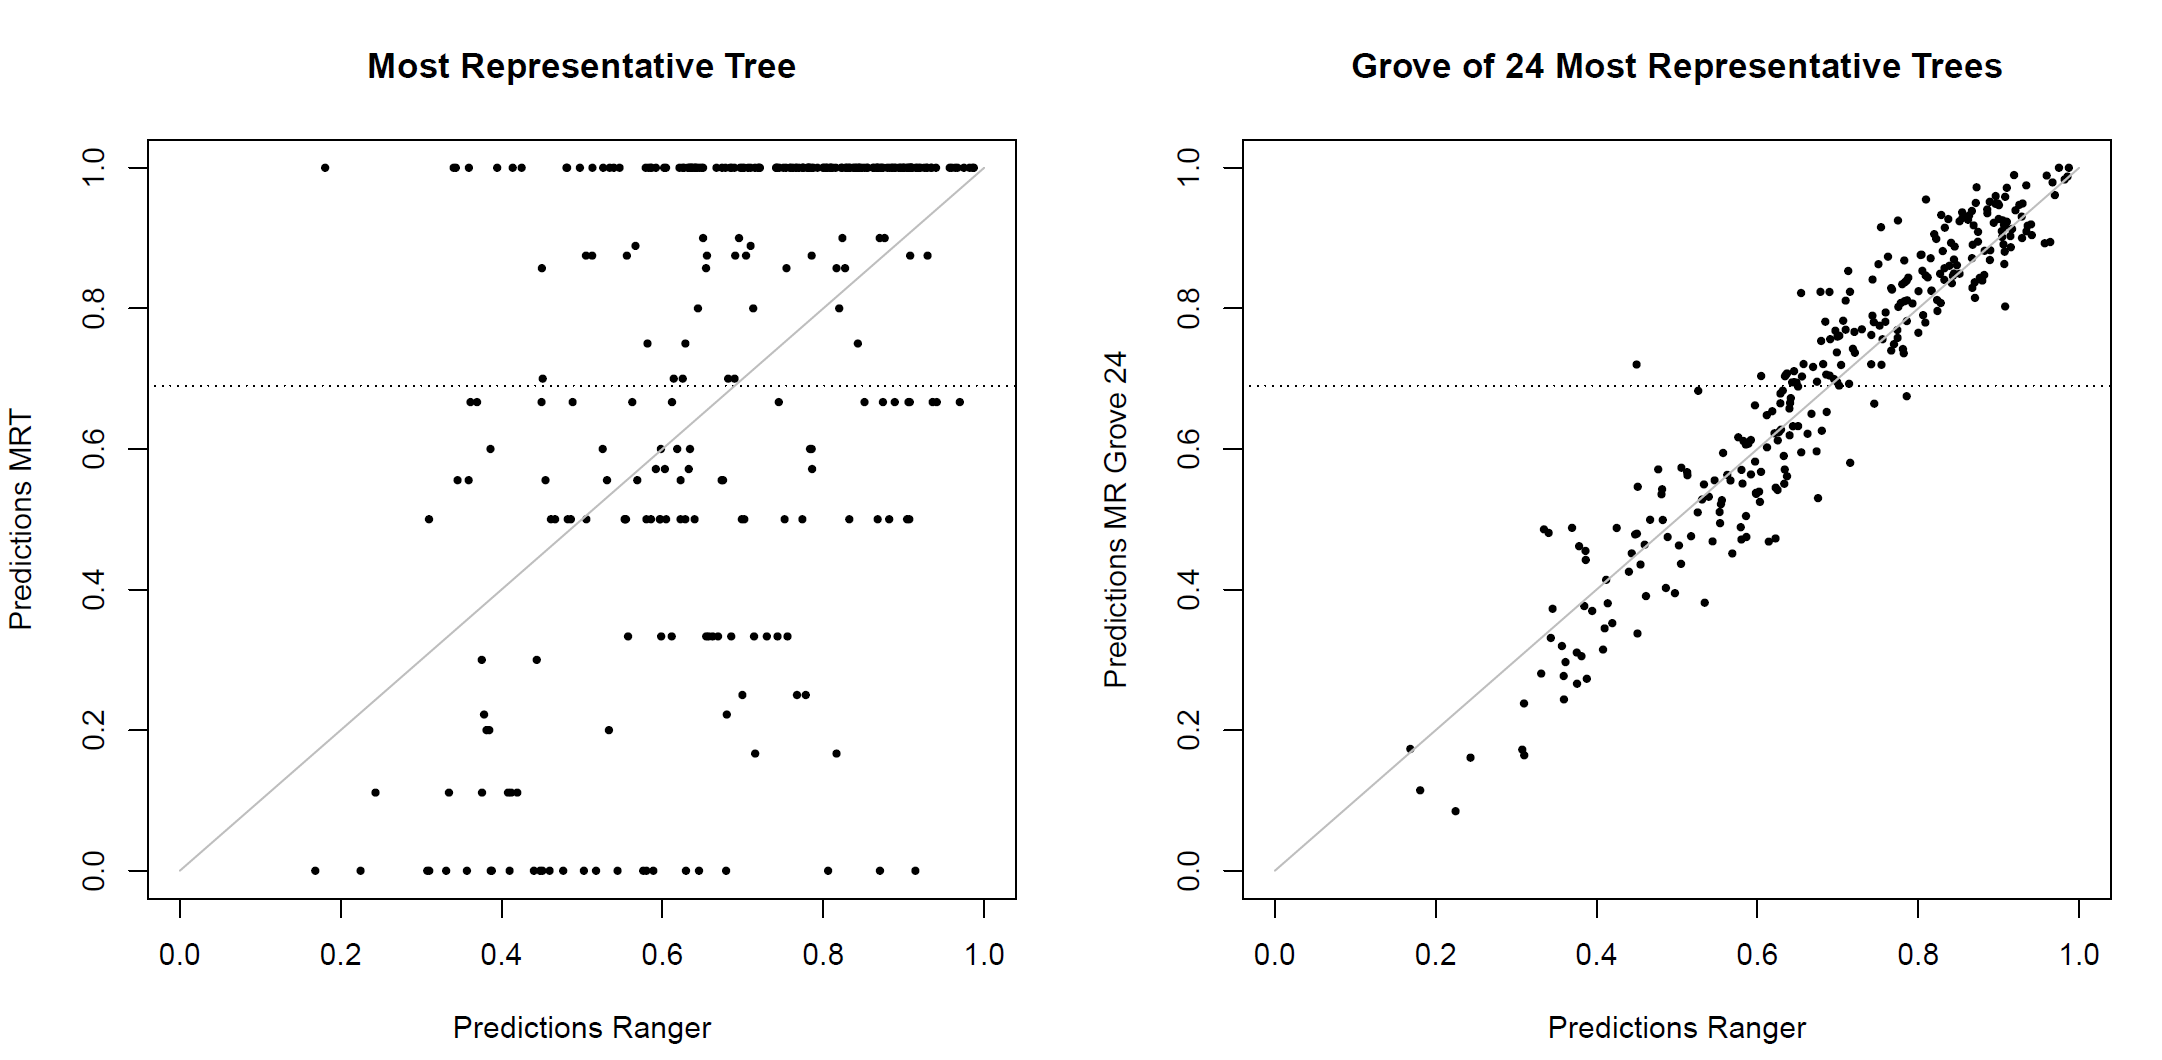
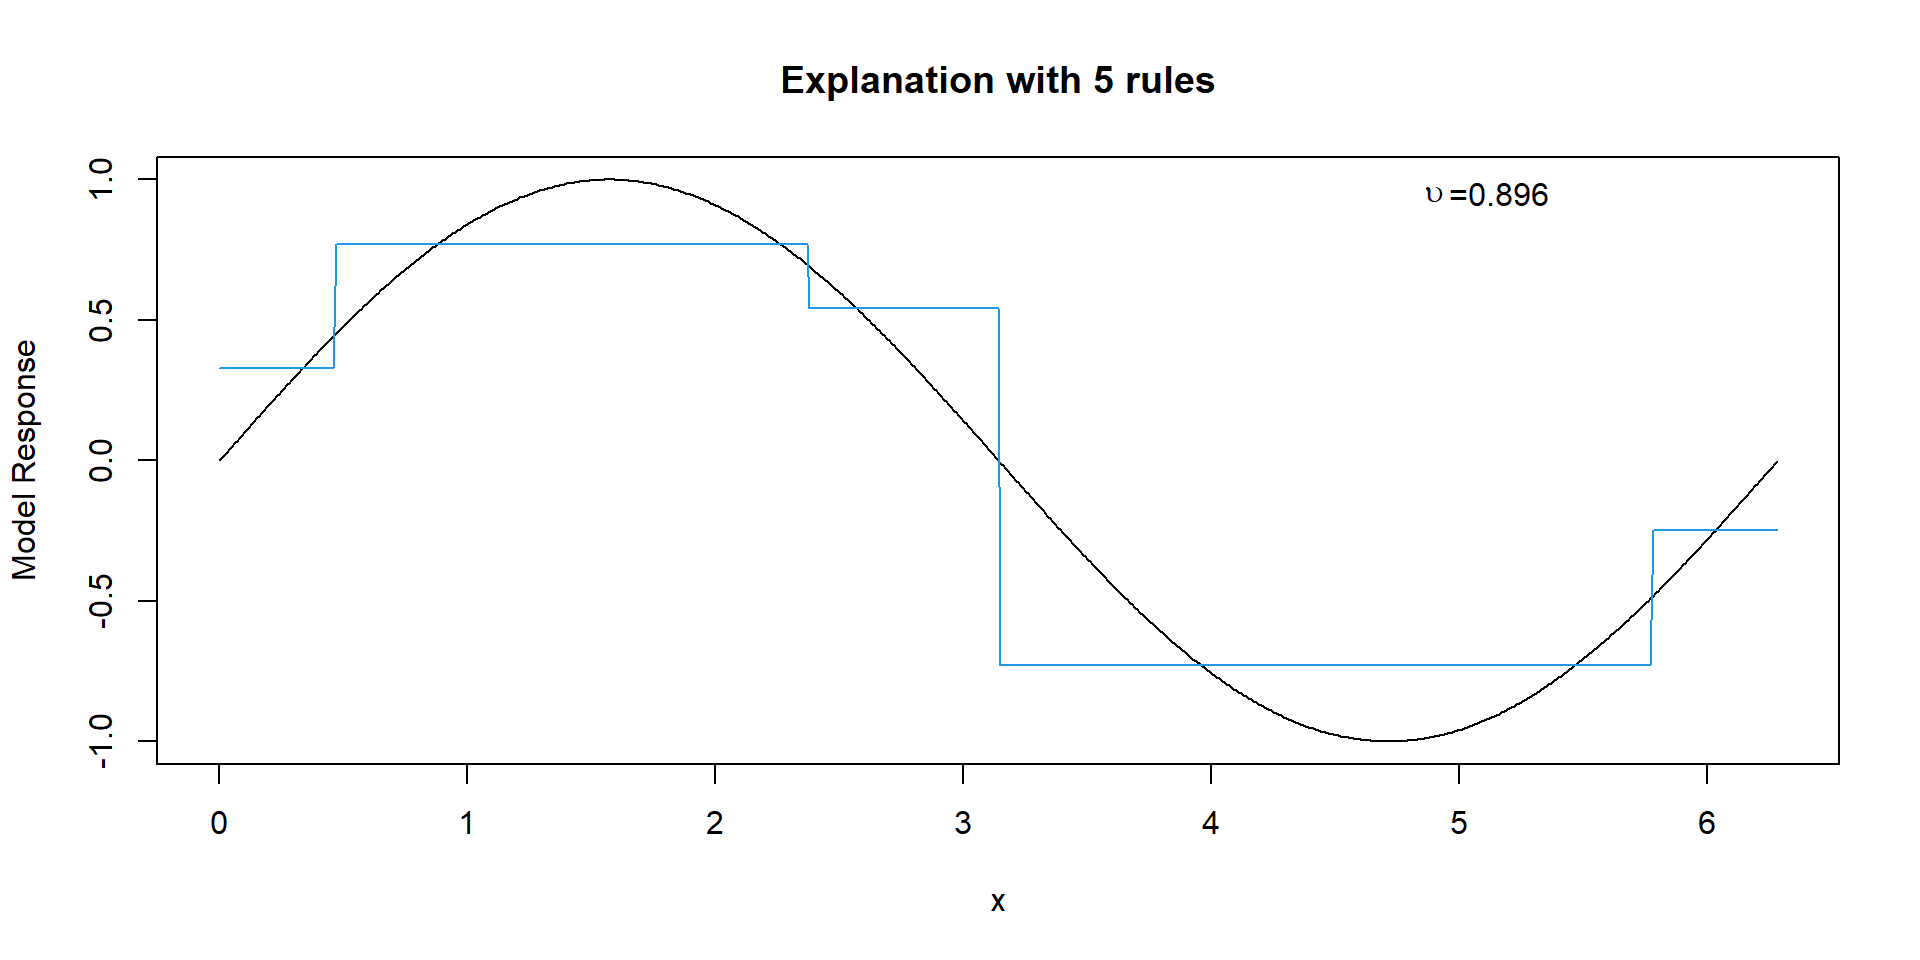
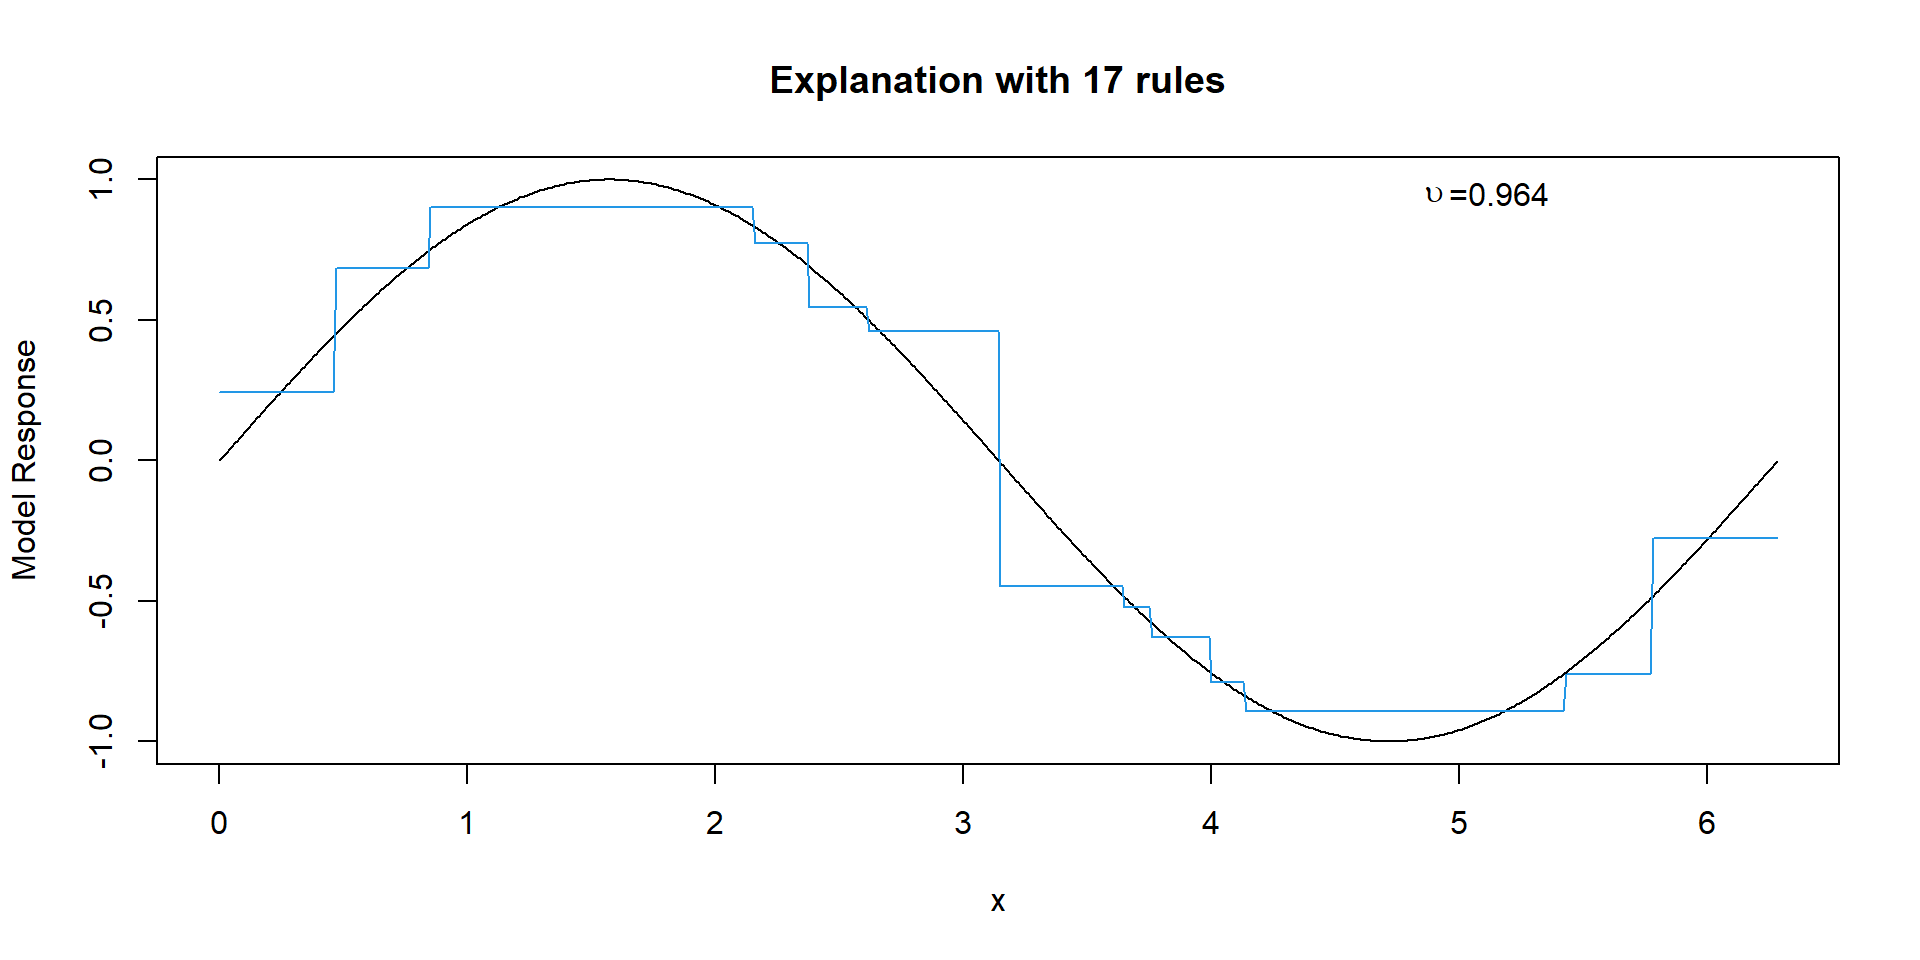
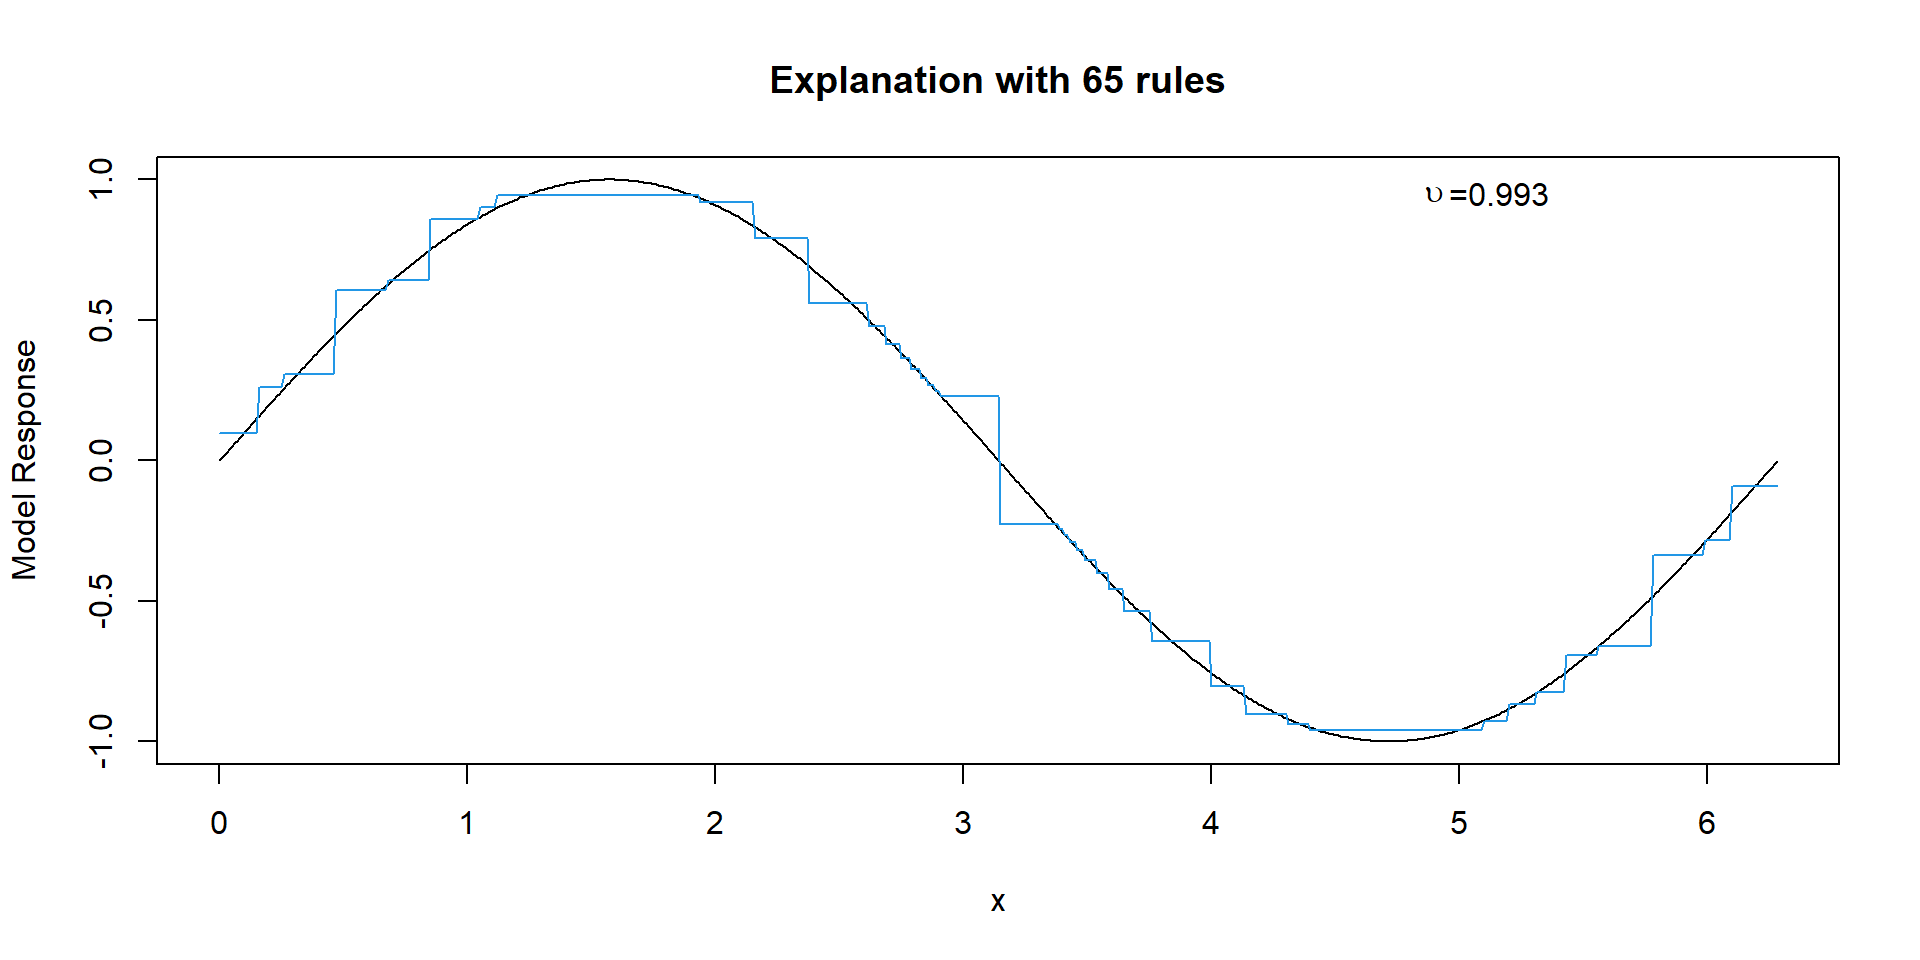
Illustration (Surrogate Rules)
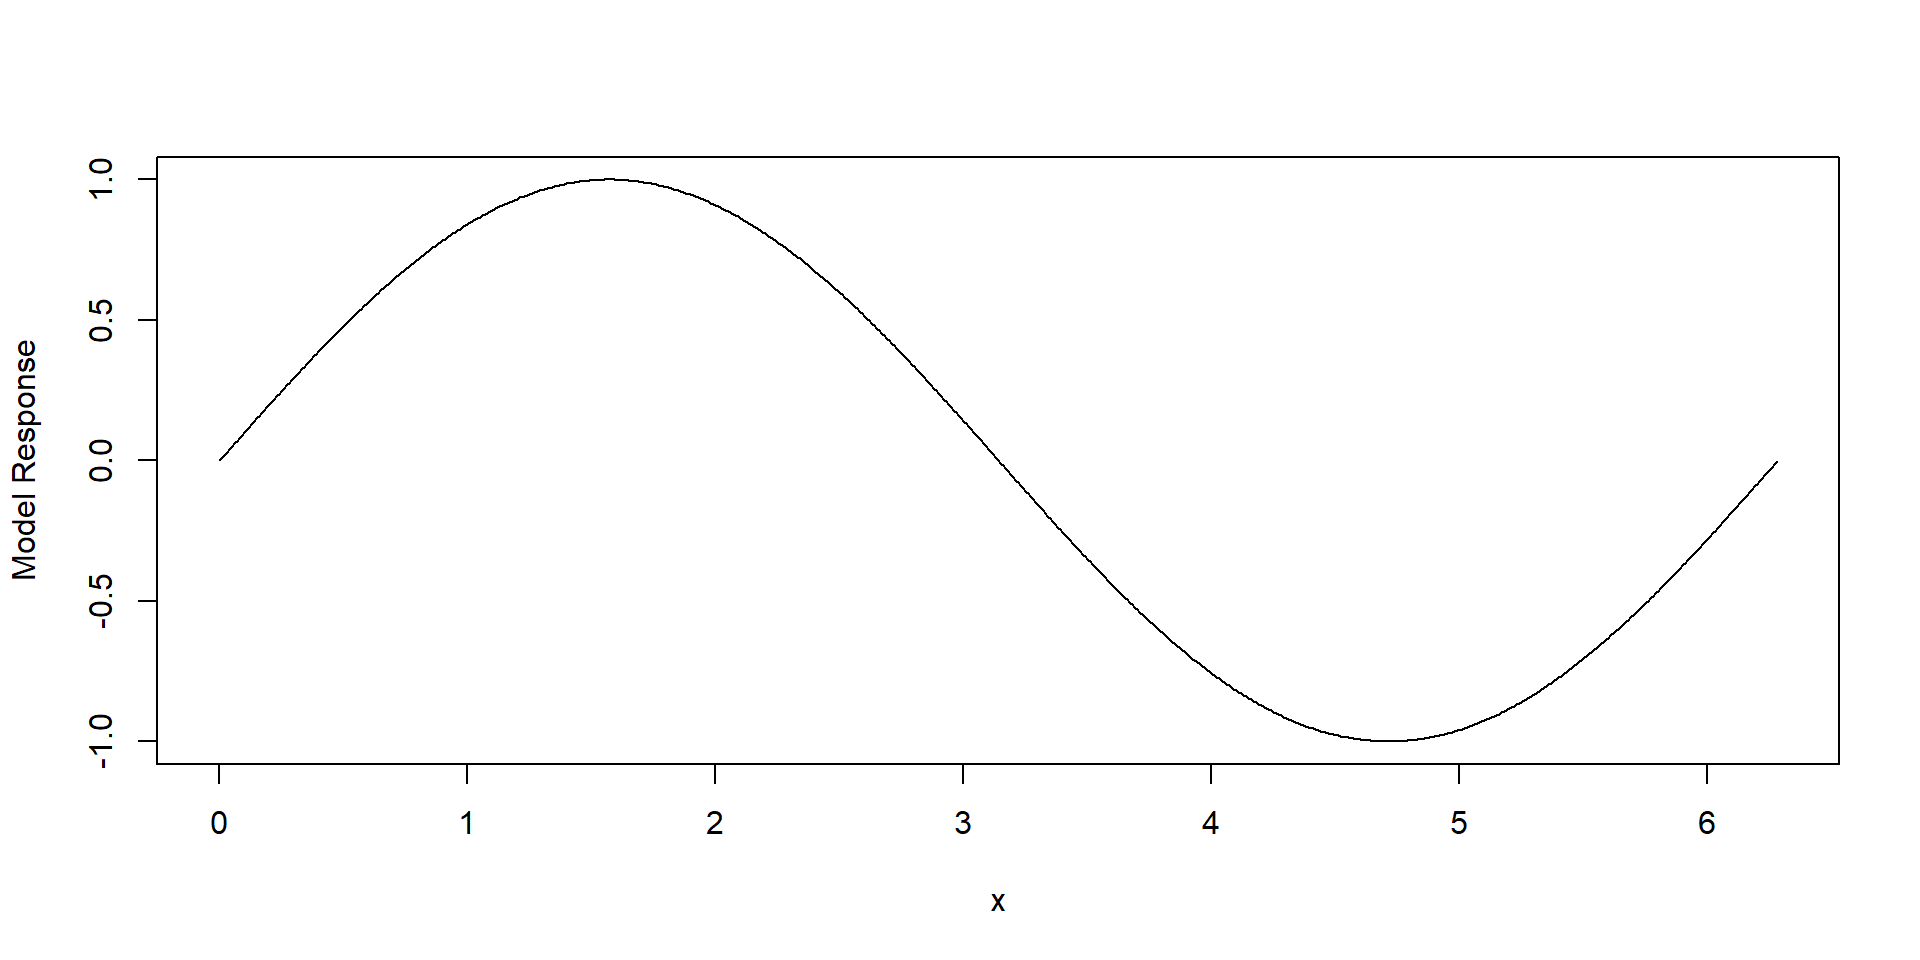
Explanation with 2 Rules
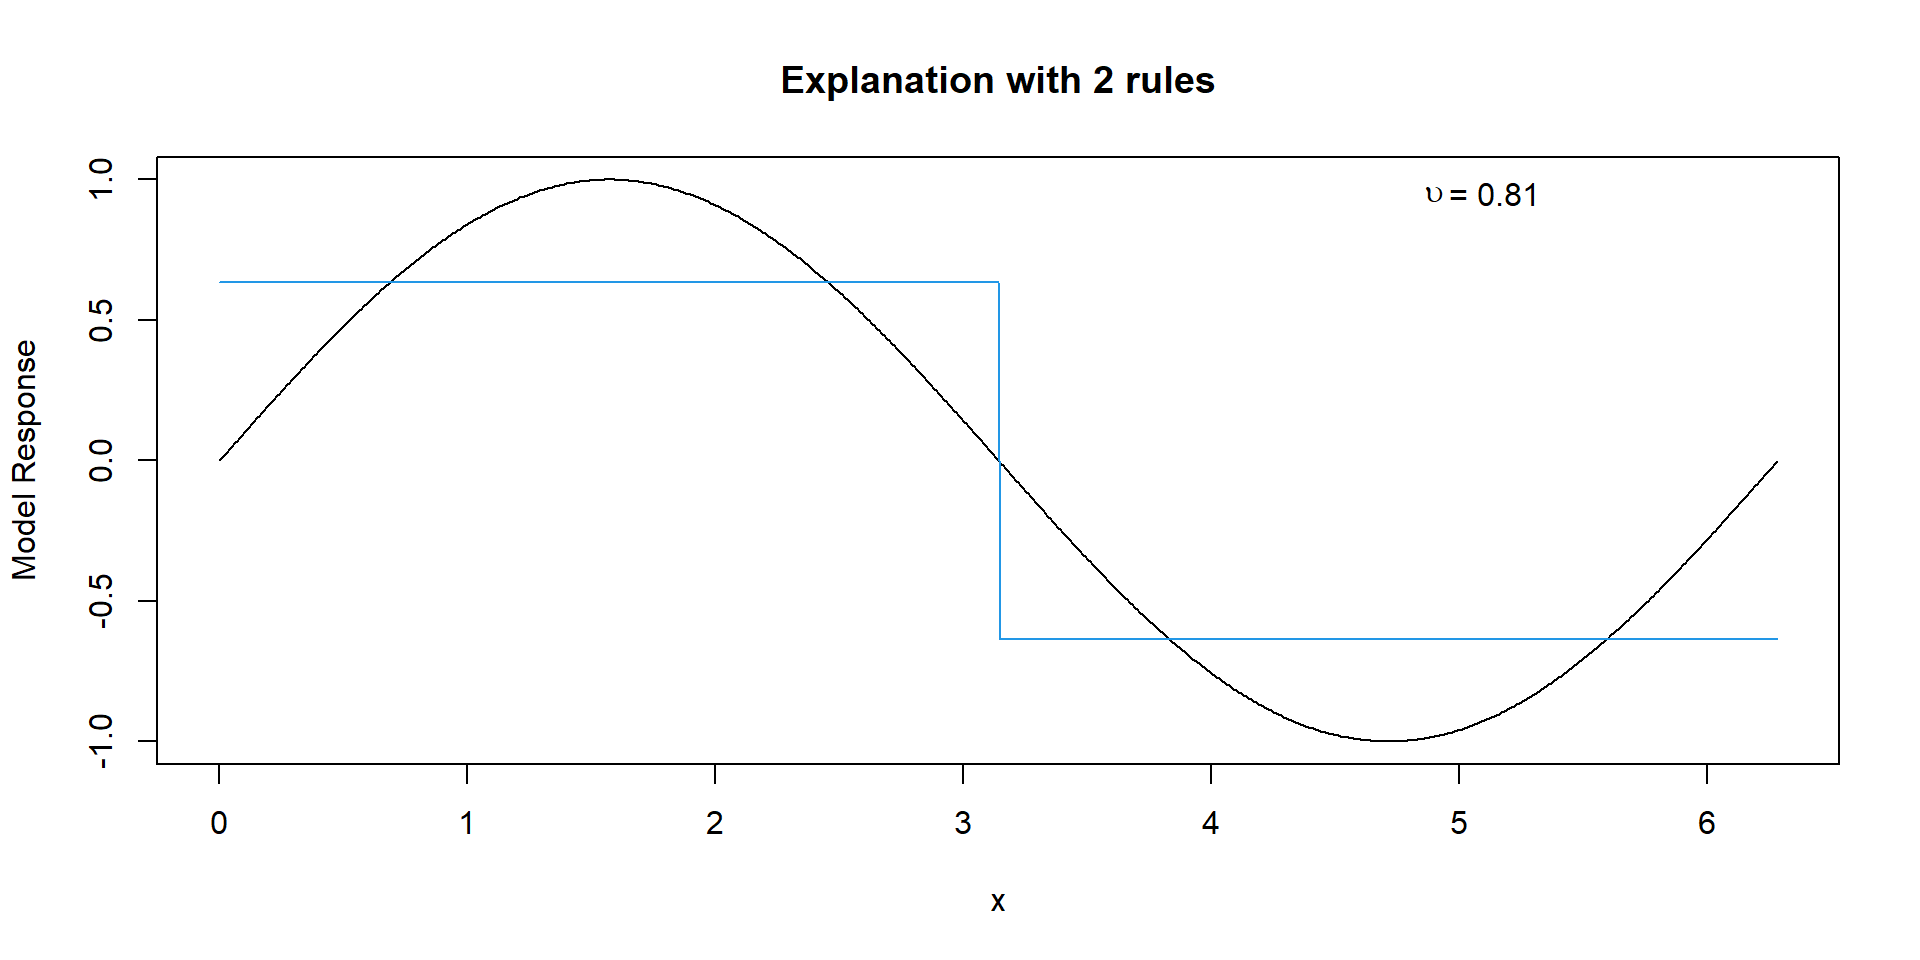
Explanation with 5 Rules
Explanation with 17 Rules
Explanation with 65 Rules
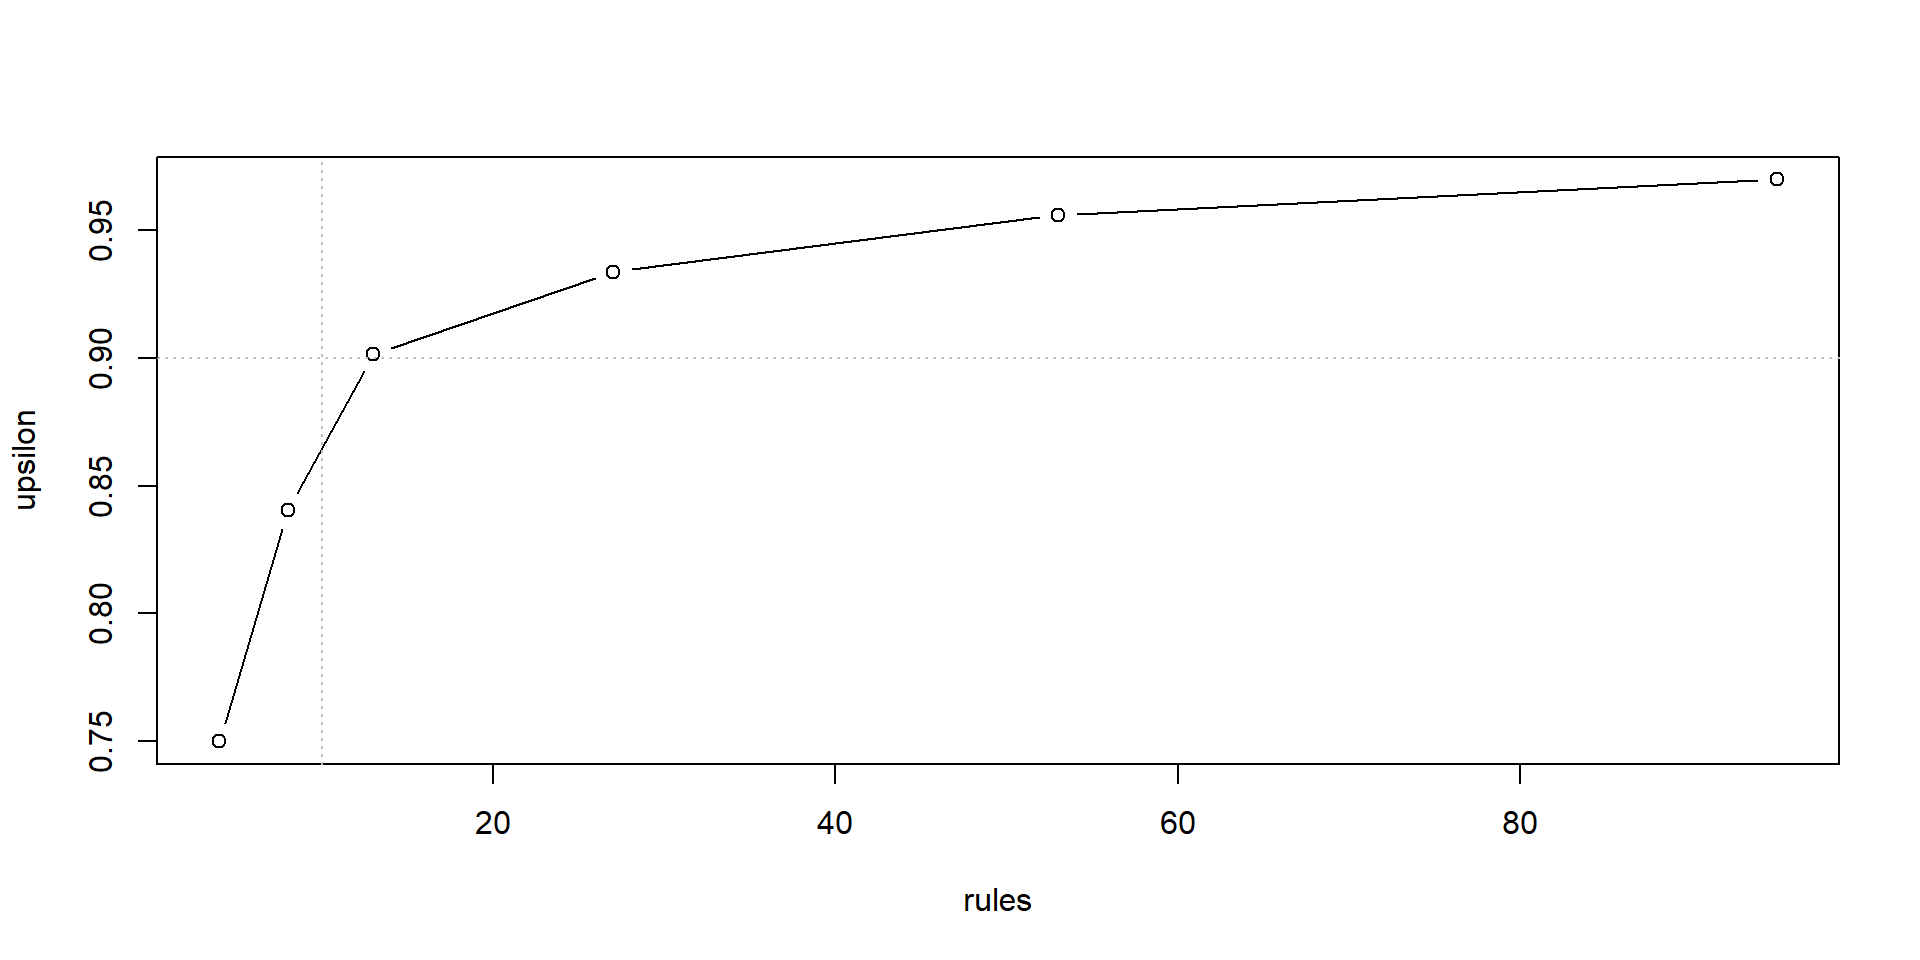
Trade-off for Boston Housing Data
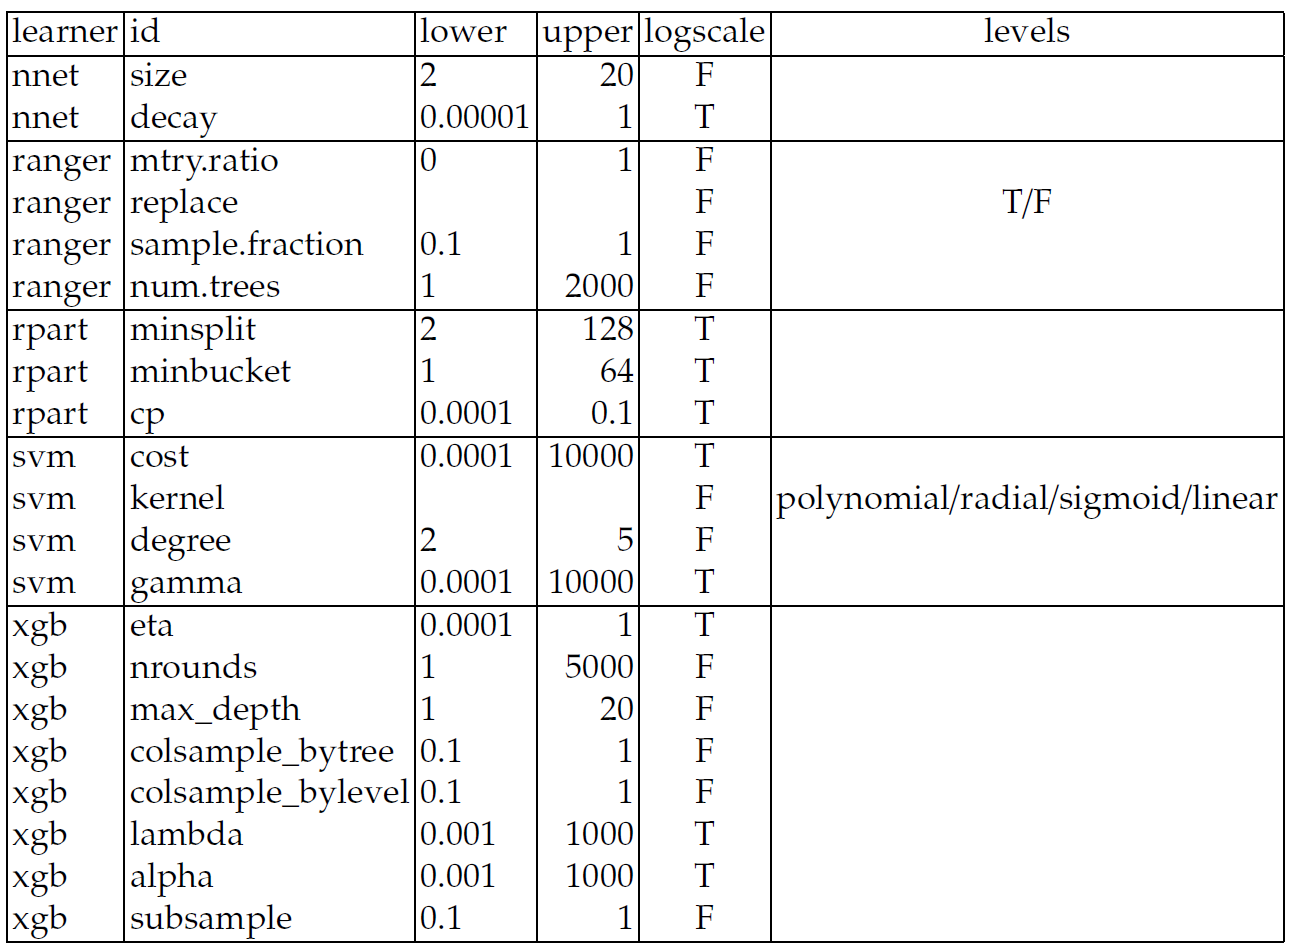
Hperparameter Tuning
- Goal: Find a reasonable parameter set, not necessarily the best,
- Random search \(n = 20\),
- Five-fold CV,
- Note: No separate test data (not scope).
- Final retraining on entire data,
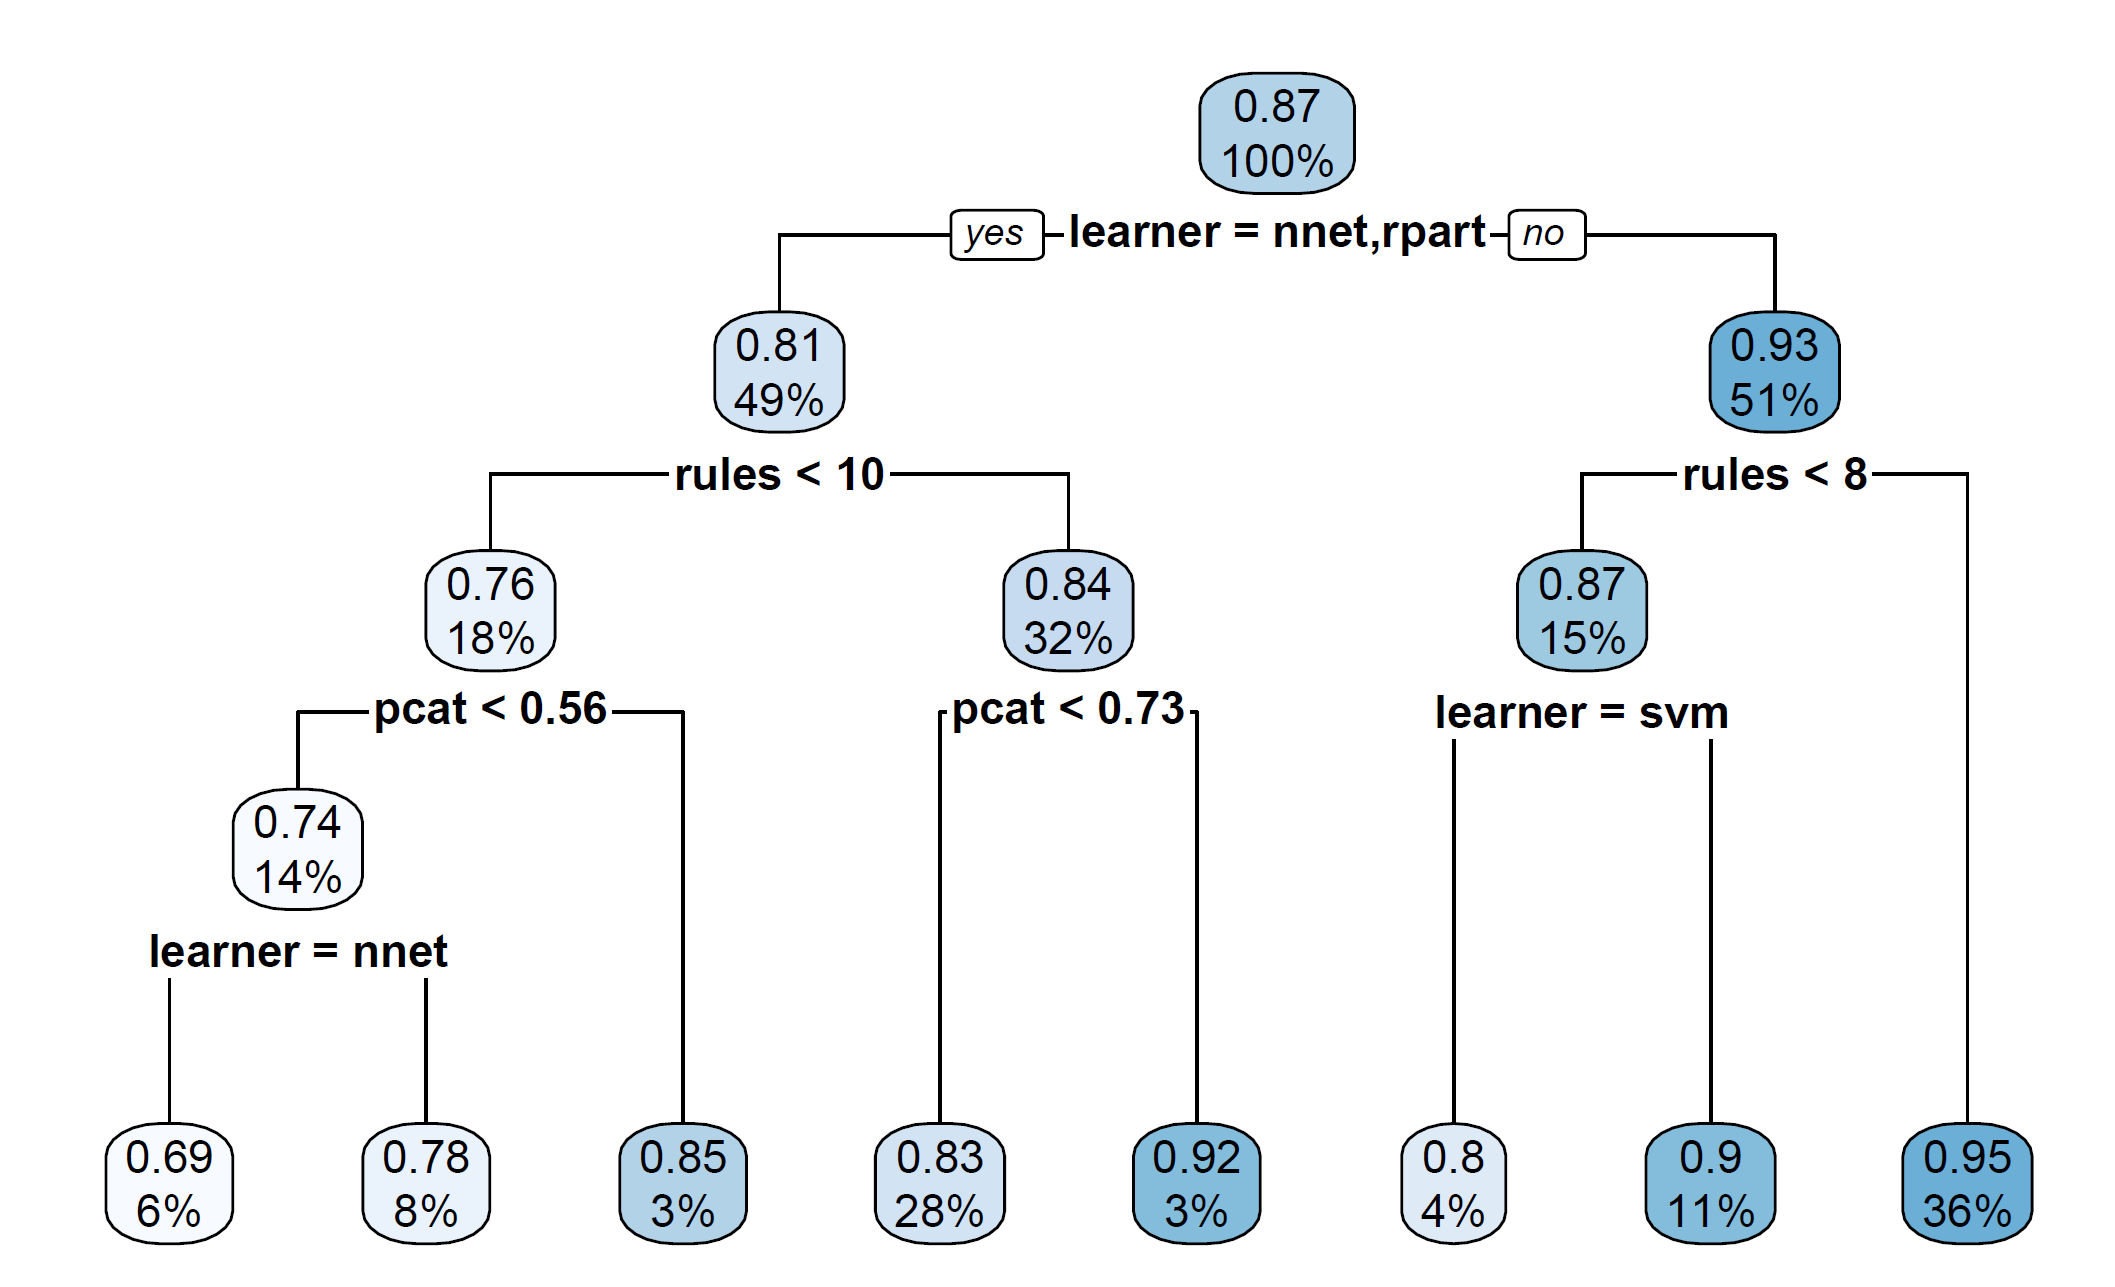
Results
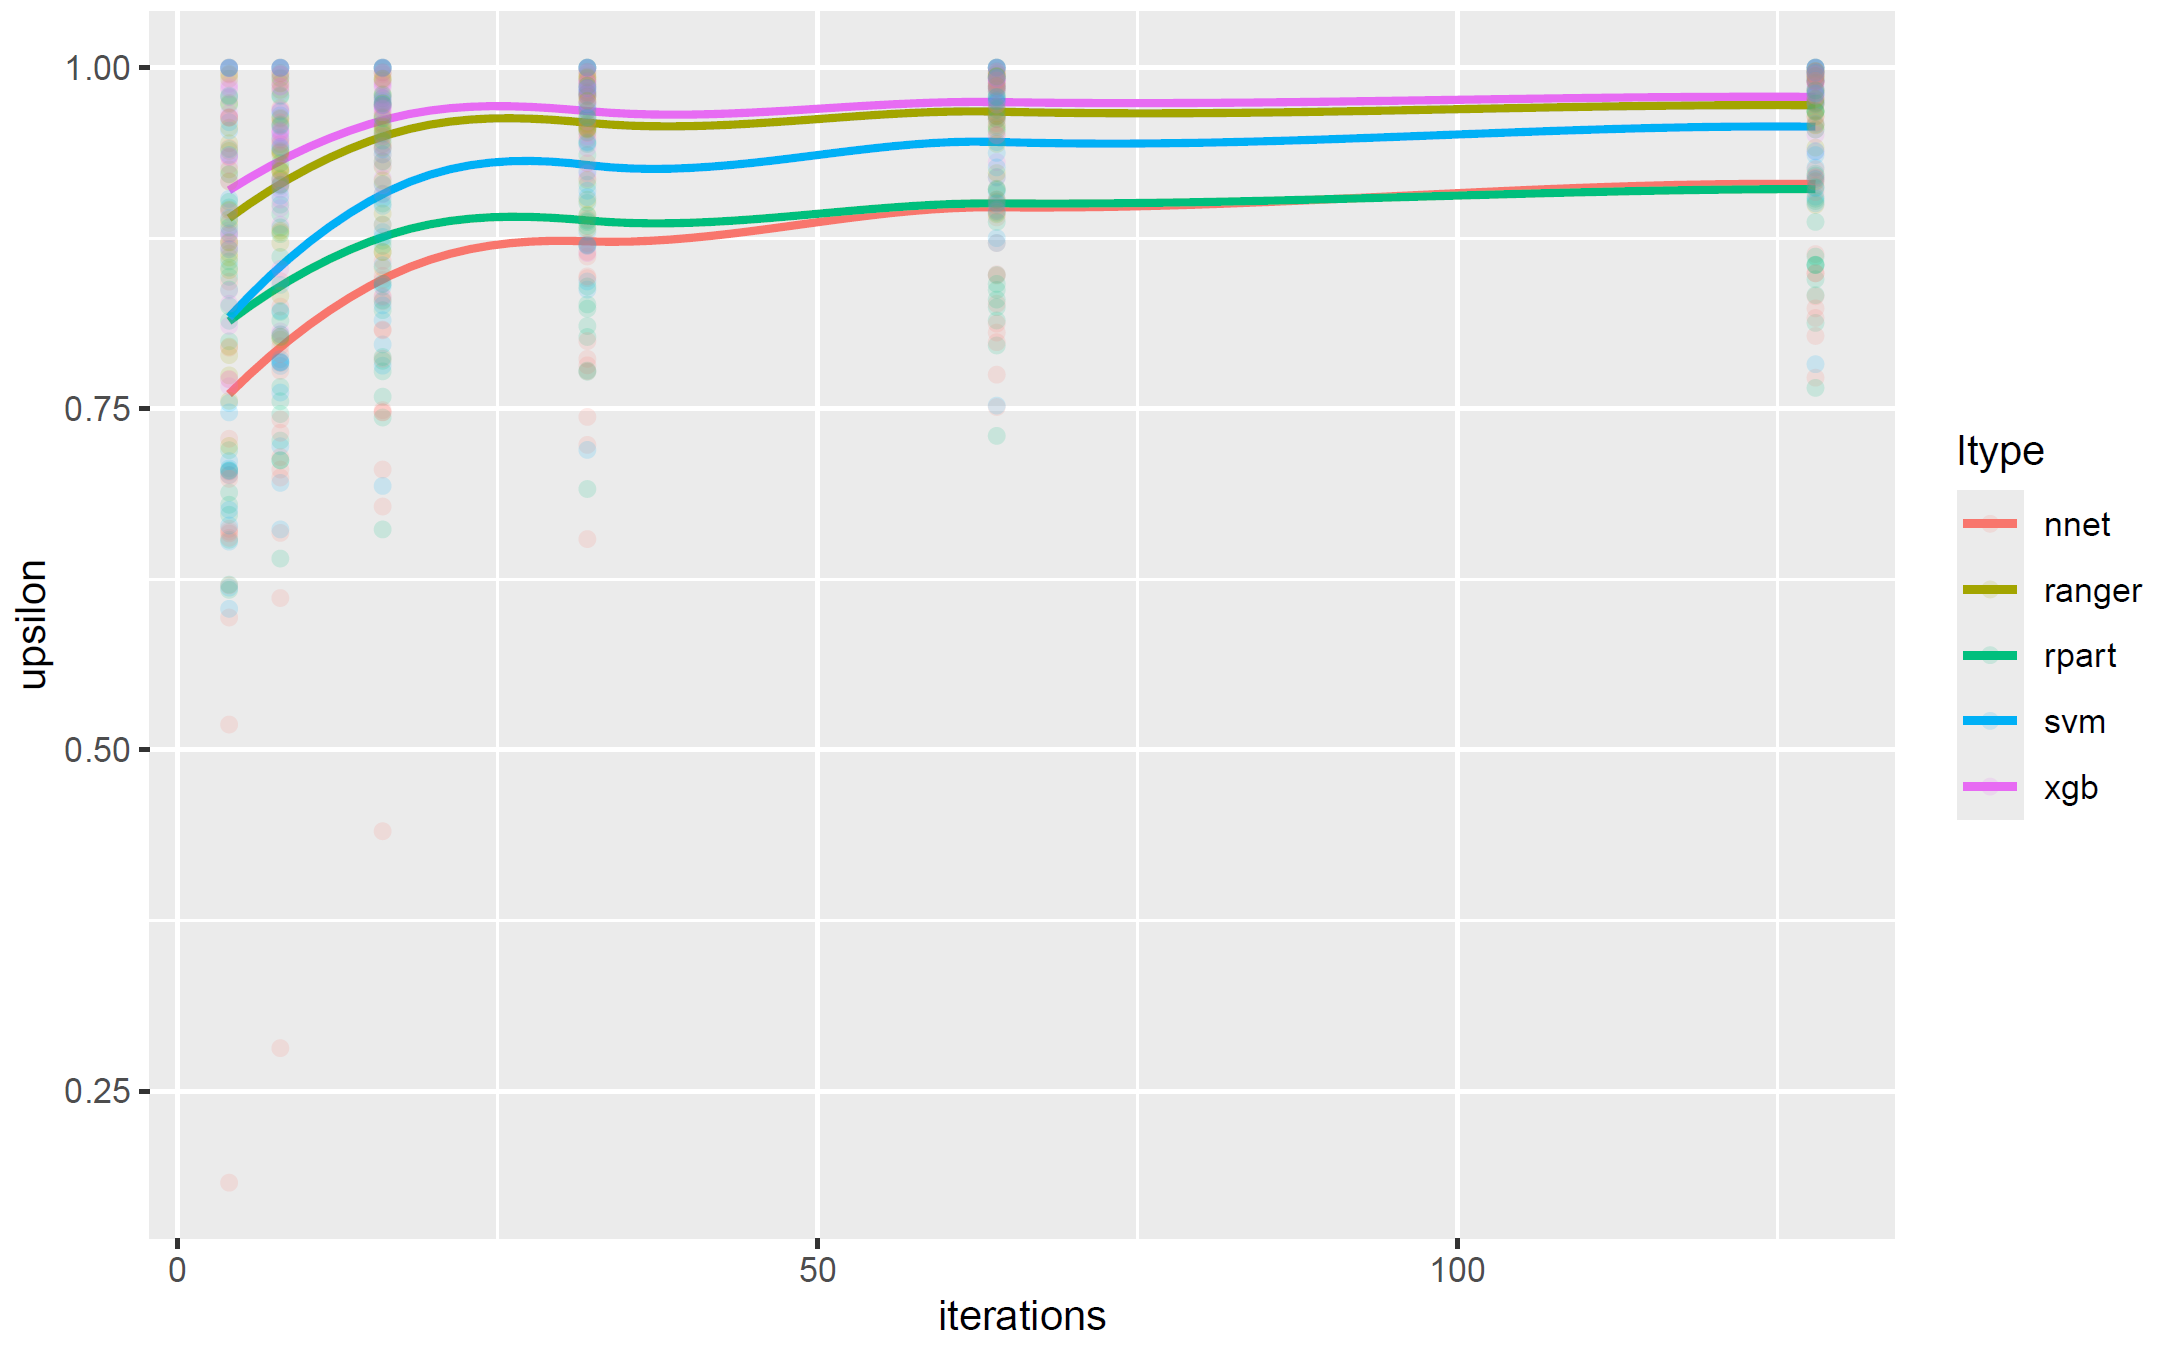
…Results
Summary
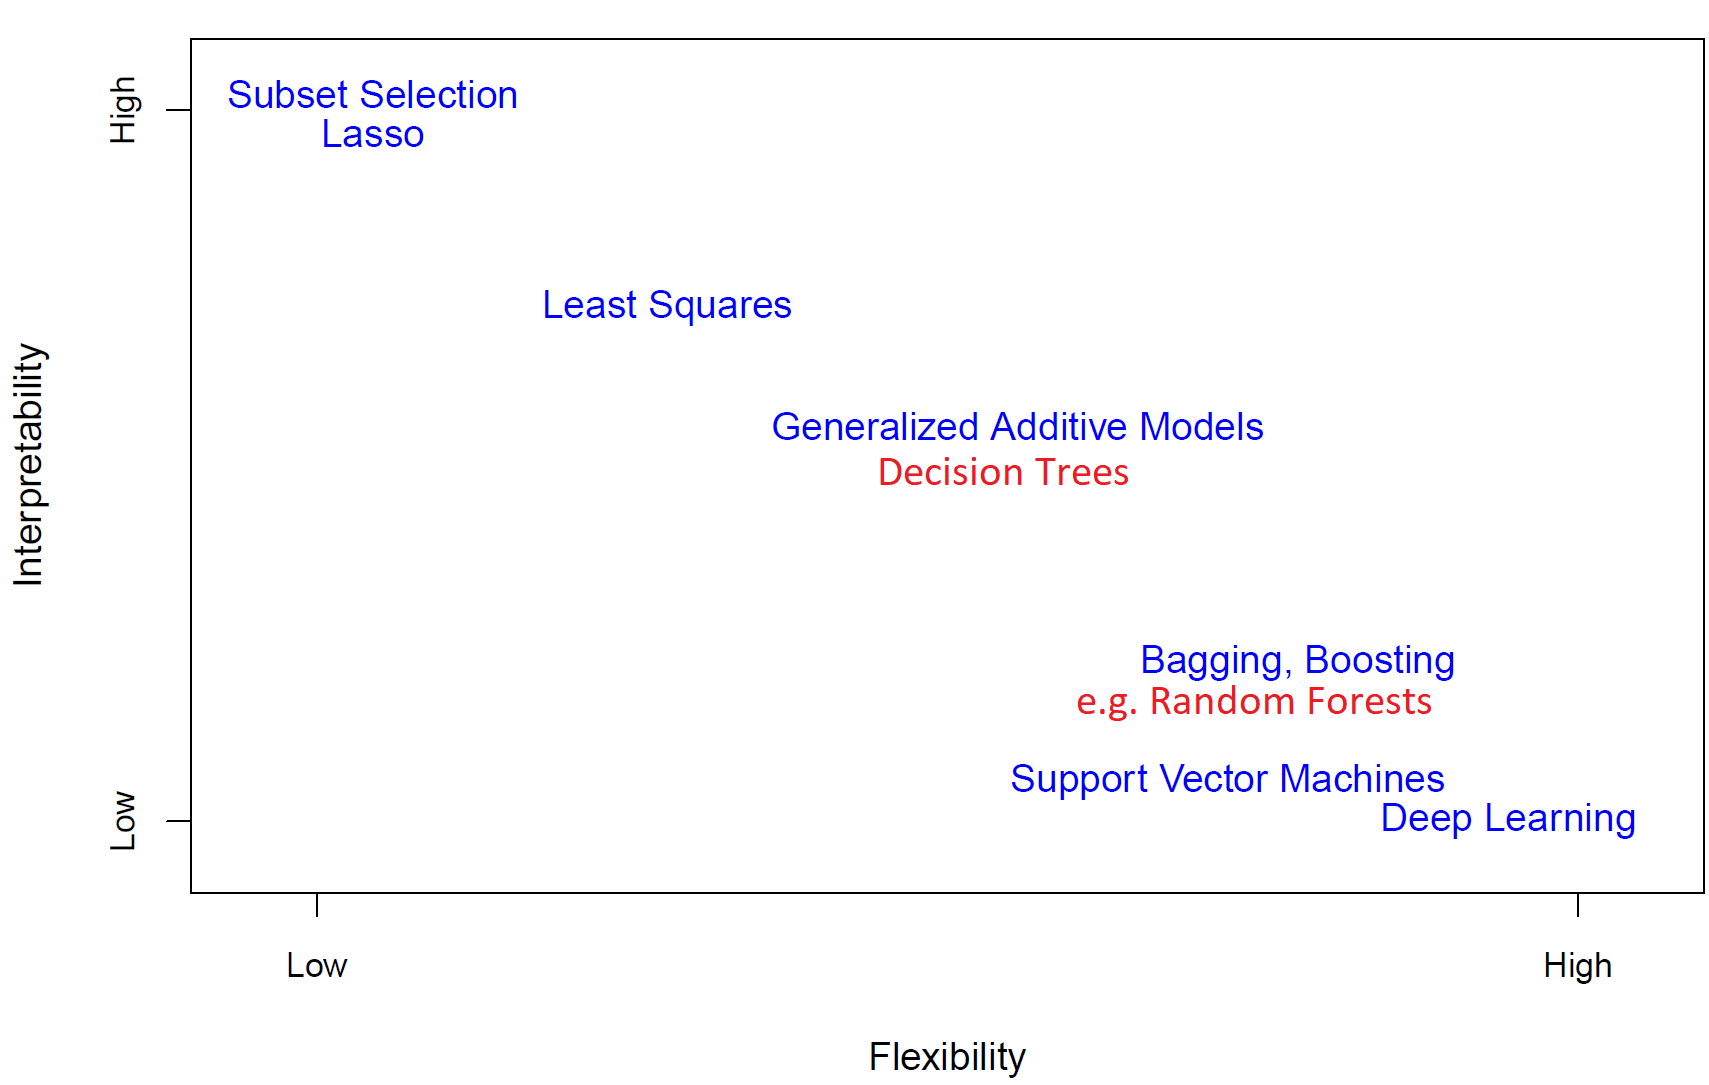
- Flexibility vs Interpretability
- Explanation Groves:
- extract set of explainable rules that maximize explainability \(\upsilon\),
- at the same time control complexity of the explanation,
- analyze trade-off between complexity and adequacy of an explanation.
- (!) There does not necessarily exist an easy explanation of a complex model.
- Implementeted in the R package xgrove.
![]()
Available on CRAN.
ECDA & GPSDAA 2026
European Conference on Data Analysis 2026

German Polish Seminar on Data Analysis and Applications (GPSDAA)

on September \(11^{th}/12^{th}\) on the island of Hiddensee.