'data.frame':   506 obs. of  16 variables:
 $ lon    : num  -71 -71 -70.9 -70.9 -70.9 ...
 $ lat    : num  42.3 42.3 42.3 42.3 42.3 ...
 $ cmedv  : num  24 21.6 34.7 33.4 36.2 28.7 22.9 22.1 16.5 18.9 ...
 $ crim   : num  0.00632 0.02731 0.02729 0.03237 0.06905 ...
 $ zn     : num  18 0 0 0 0 0 12.5 12.5 12.5 12.5 ...
 $ indus  : num  2.31 7.07 7.07 2.18 2.18 2.18 7.87 7.87 7.87 7.87 ...
 $ chas   : Factor w/ 2 levels "0","1": 1 1 1 1 1 1 1 1 1 1 ...
 $ nox    : num  0.538 0.469 0.469 0.458 0.458 0.458 0.524 0.524 0.524 0.524 ...
 $ rm     : num  6.58 6.42 7.18 7 7.15 ...
 $ age    : num  65.2 78.9 61.1 45.8 54.2 58.7 66.6 96.1 100 85.9 ...
 $ dis    : num  4.09 4.97 4.97 6.06 6.06 ...
 $ rad    : int  1 2 2 3 3 3 5 5 5 5 ...
 $ tax    : int  296 242 242 222 222 222 311 311 311 311 ...
 $ ptratio: num  15.3 17.8 17.8 18.7 18.7 18.7 15.2 15.2 15.2 15.2 ...
 $ b      : num  397 397 393 395 397 ...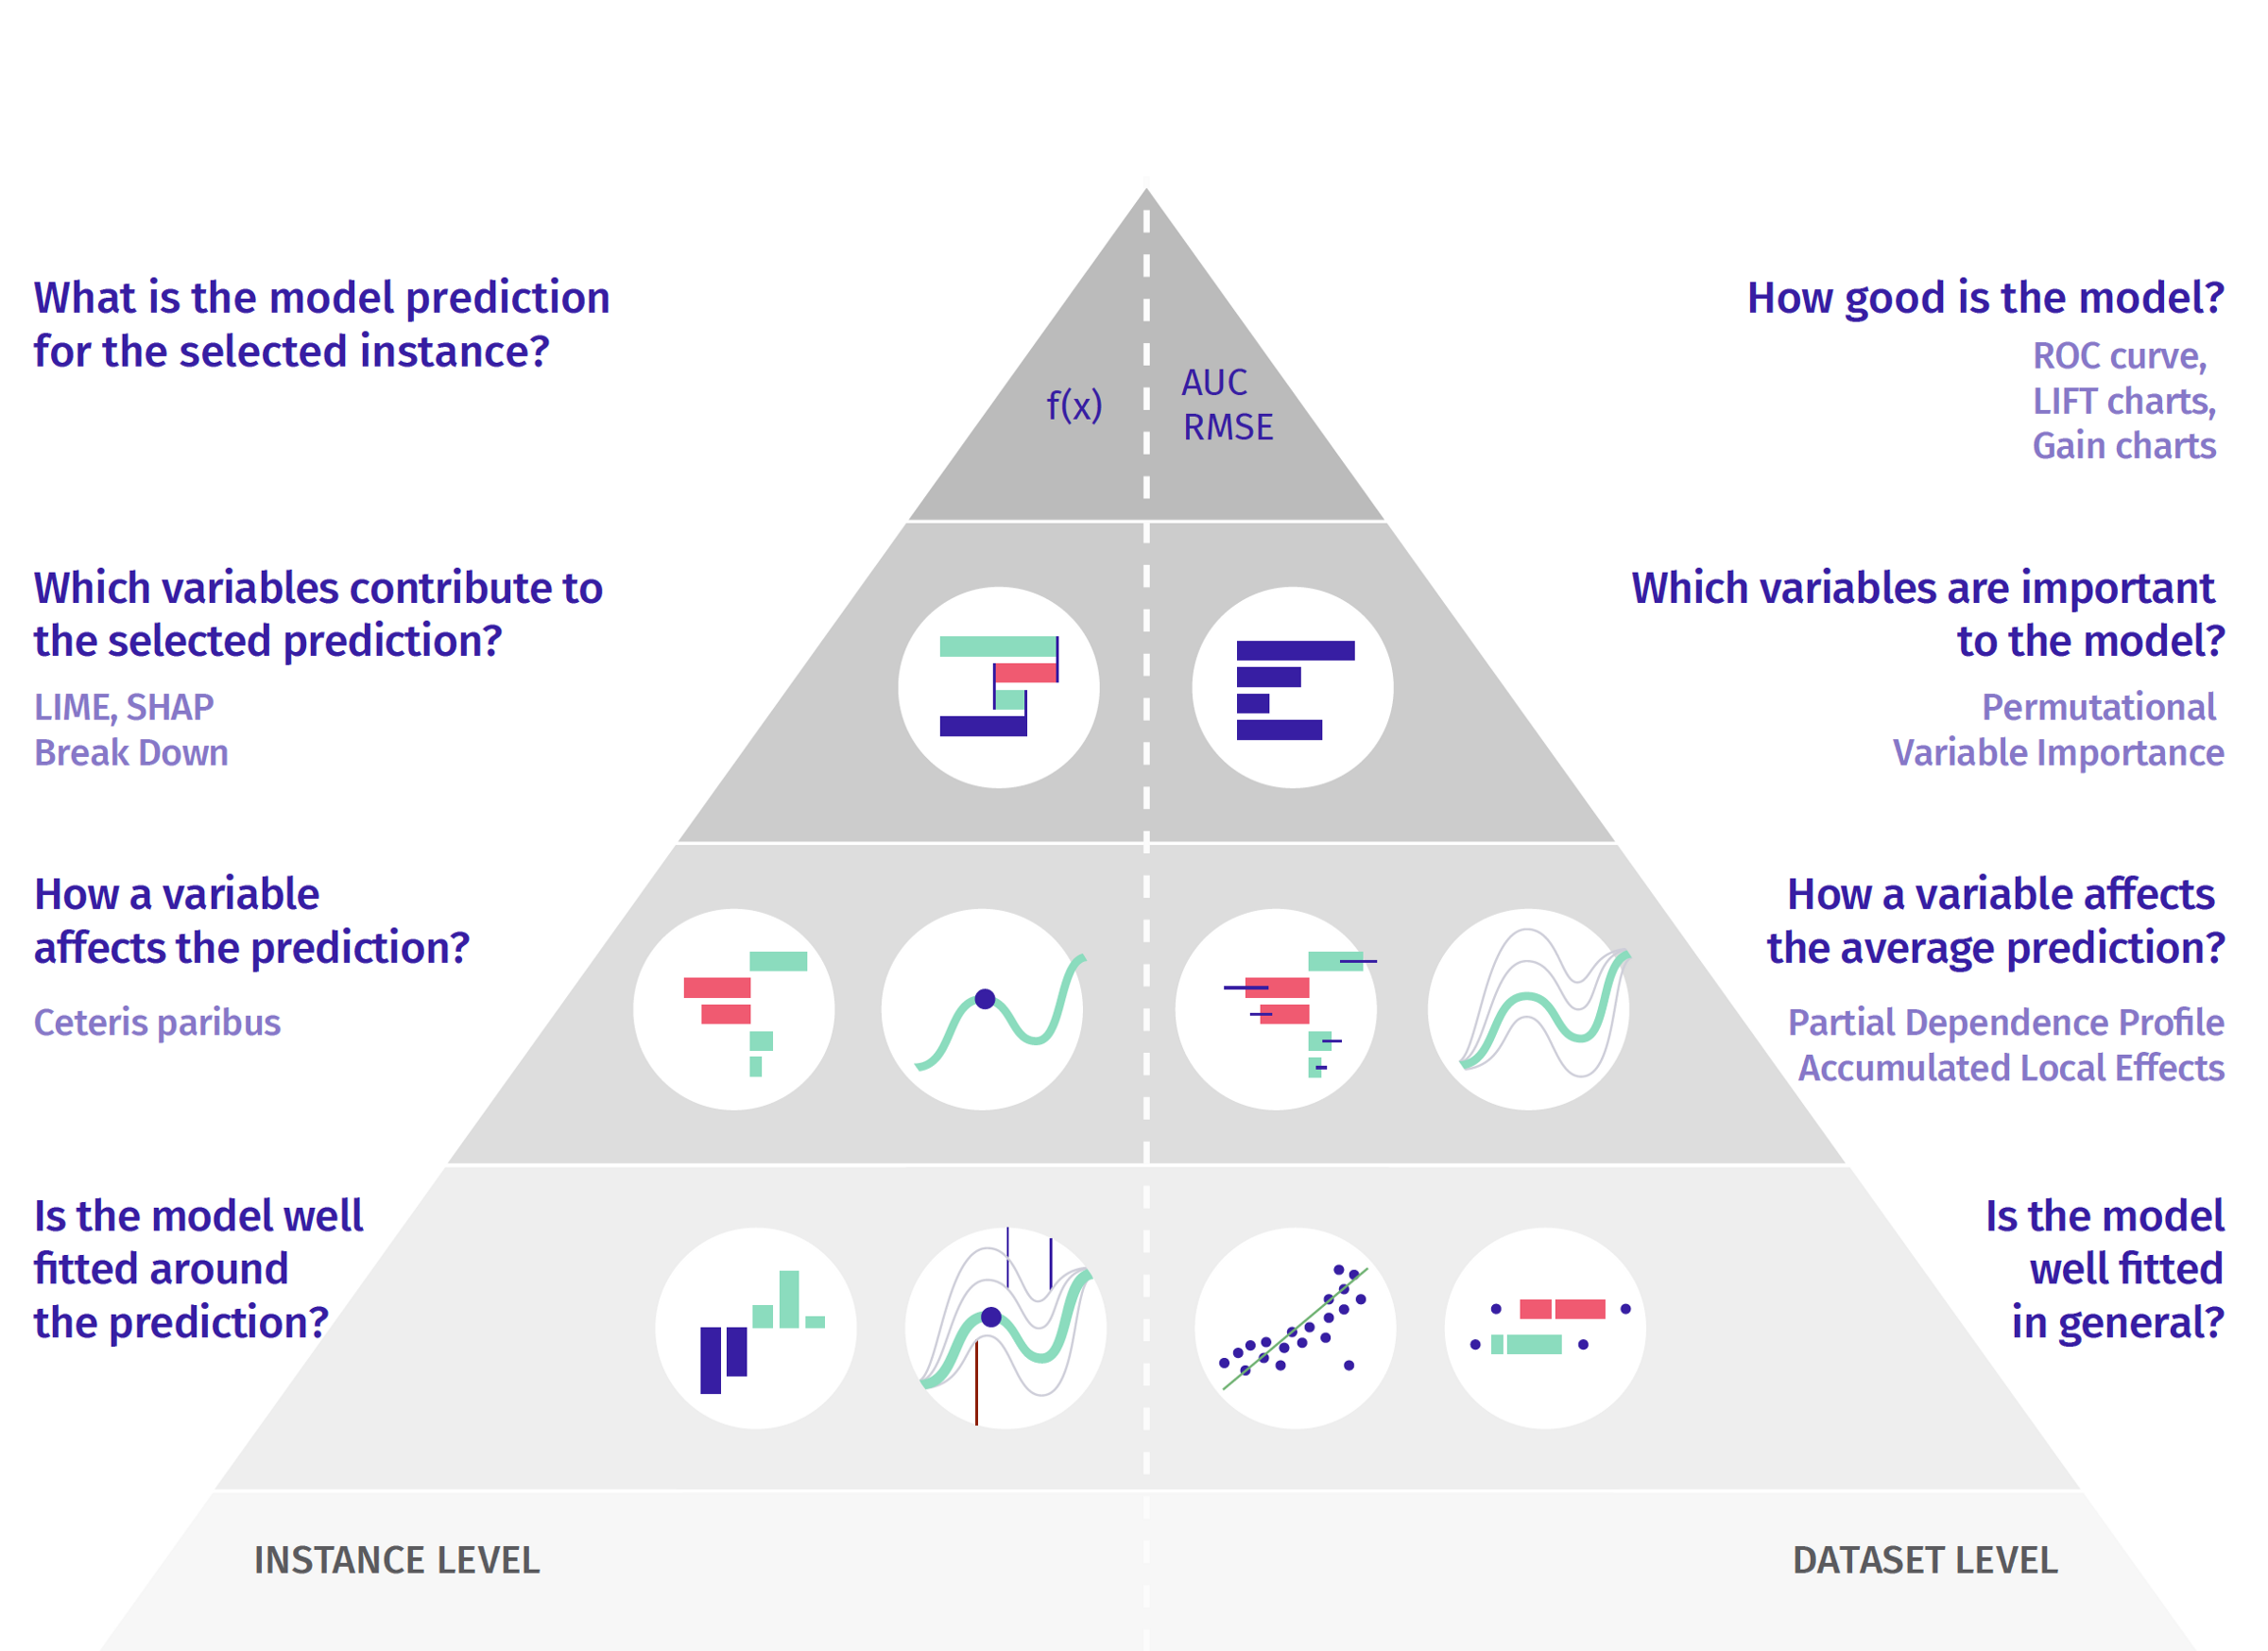
$ lstat : num 4.98 9.14 4.03 2.94 5.33 ...Explanation Groves
Analyzing the Trade-off between Complexity and Adequacy of an Explanation
Gero Szepannek, Stralsund University of Applied Sciences
10-07-2024
Flexibility vs. Interpretability
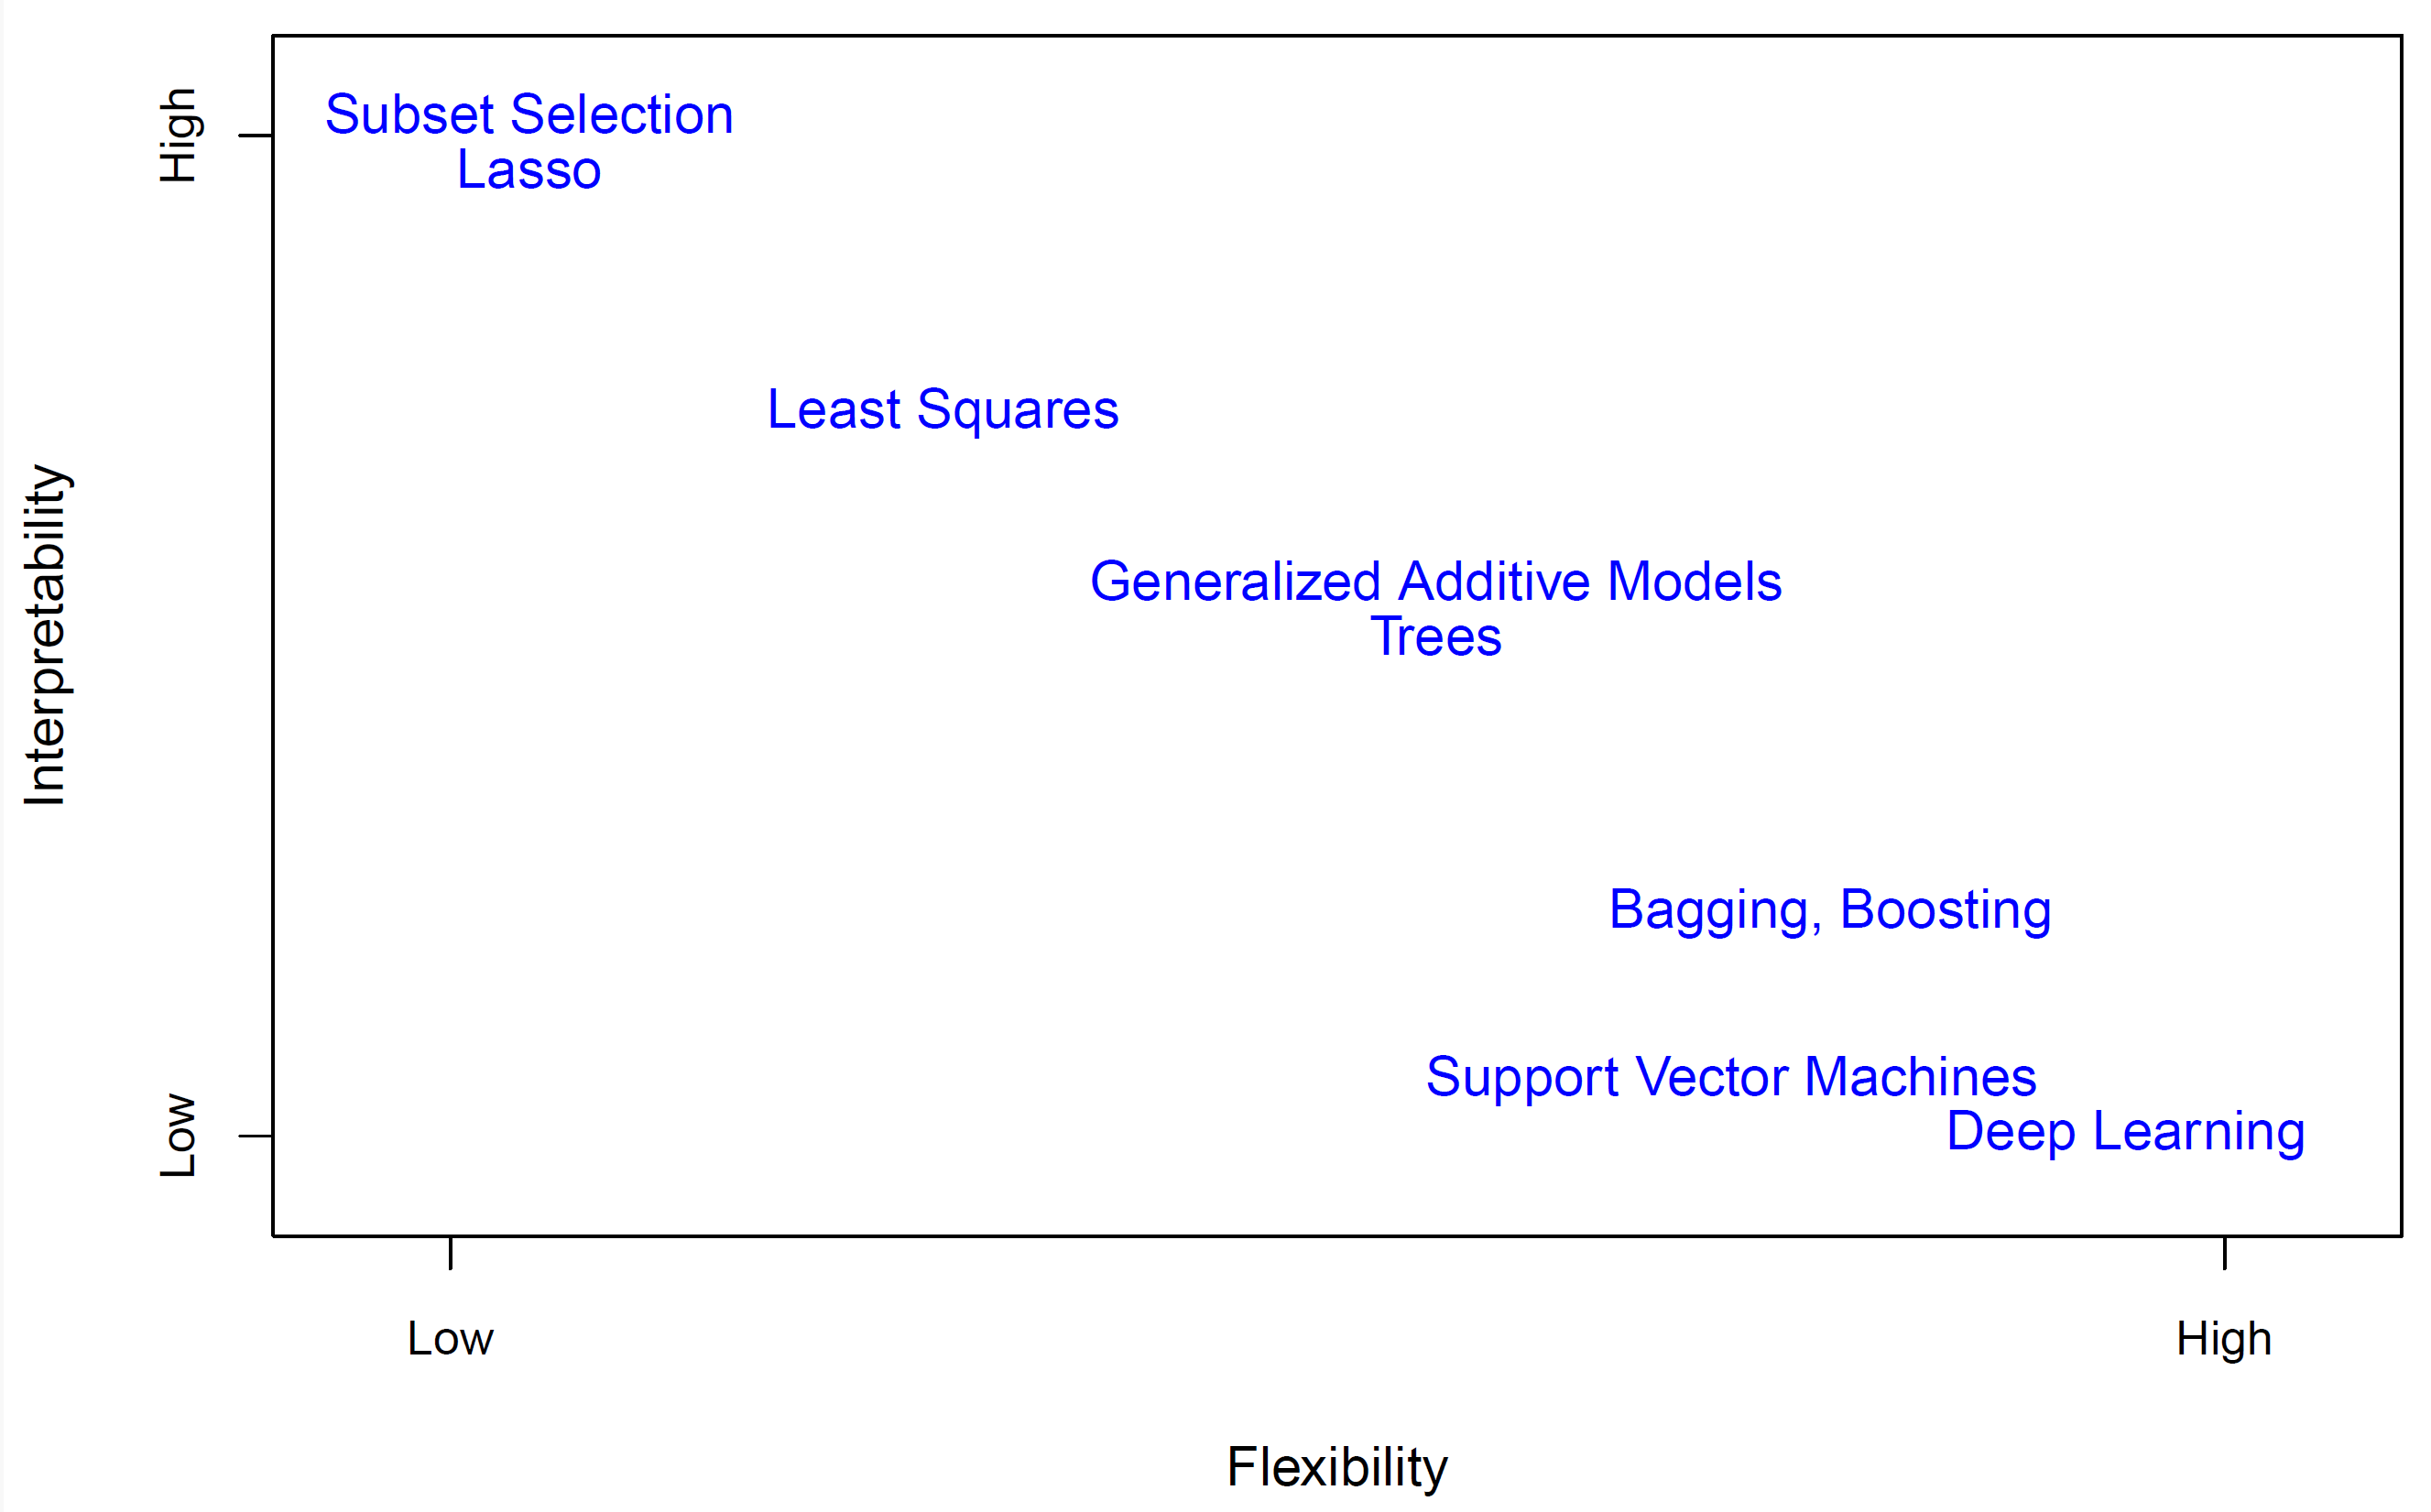
James et al. (2019)
Motivation
Example: Boston Housing Data
- Harrison and Rubinfeld (1978)
- 80:20 Split in training and validation data.
Moitivation (II): Performance vs. Interpretability
- Decision Tree (Therneau and Atkinson 2015)
- …vs. RF (Fernández-Delgado et al. 2014; Wright and Ziegler 2017).
- No HPT (Szepannek 2017; Probst, Boulesteix, and Bischl 2021).
- Forest better but no longer interpretable due to large number of rules!
- Humans’ working memory capacity limited (Miller 1956; Cowan 2010).
| rpart | ranger | |
|---|---|---|
| Test R² | 0.821 | 0.867 |
| # rules | 8.000 | 65120.000 |
Explanation Groves…
Create surrogate model (Molnar 2022; Banerjee, Ding, and Noone 2012)
…using the predictions of the model to be interpreted on training data as target variable.
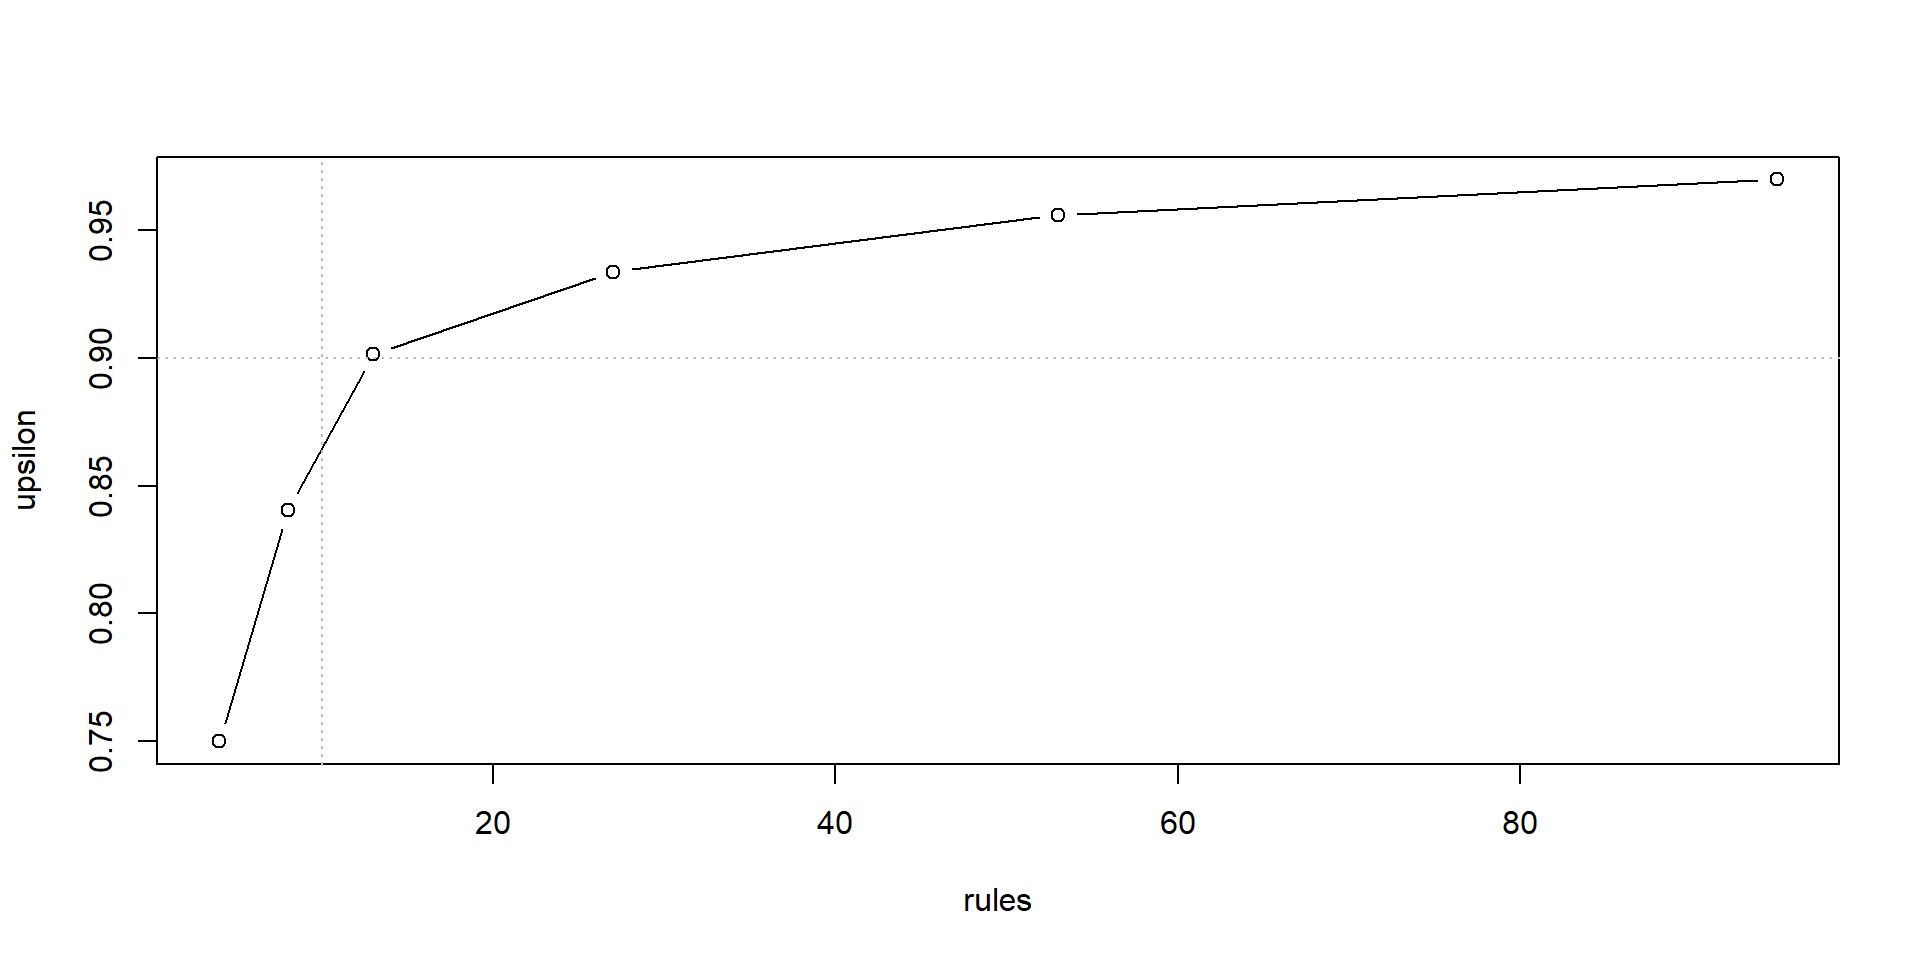
Adequacy of the explanation (XAI) can be assessed via explainability \(\Upsilon = 1 - \frac{ESD(XAI)}{ESD(\emptyset)}\) (Szepannek and Lübke 2023) with
\[ ESD(XAI) = \int (\hat{f}(X) - XAI(X))^2 \; d P(X) \]
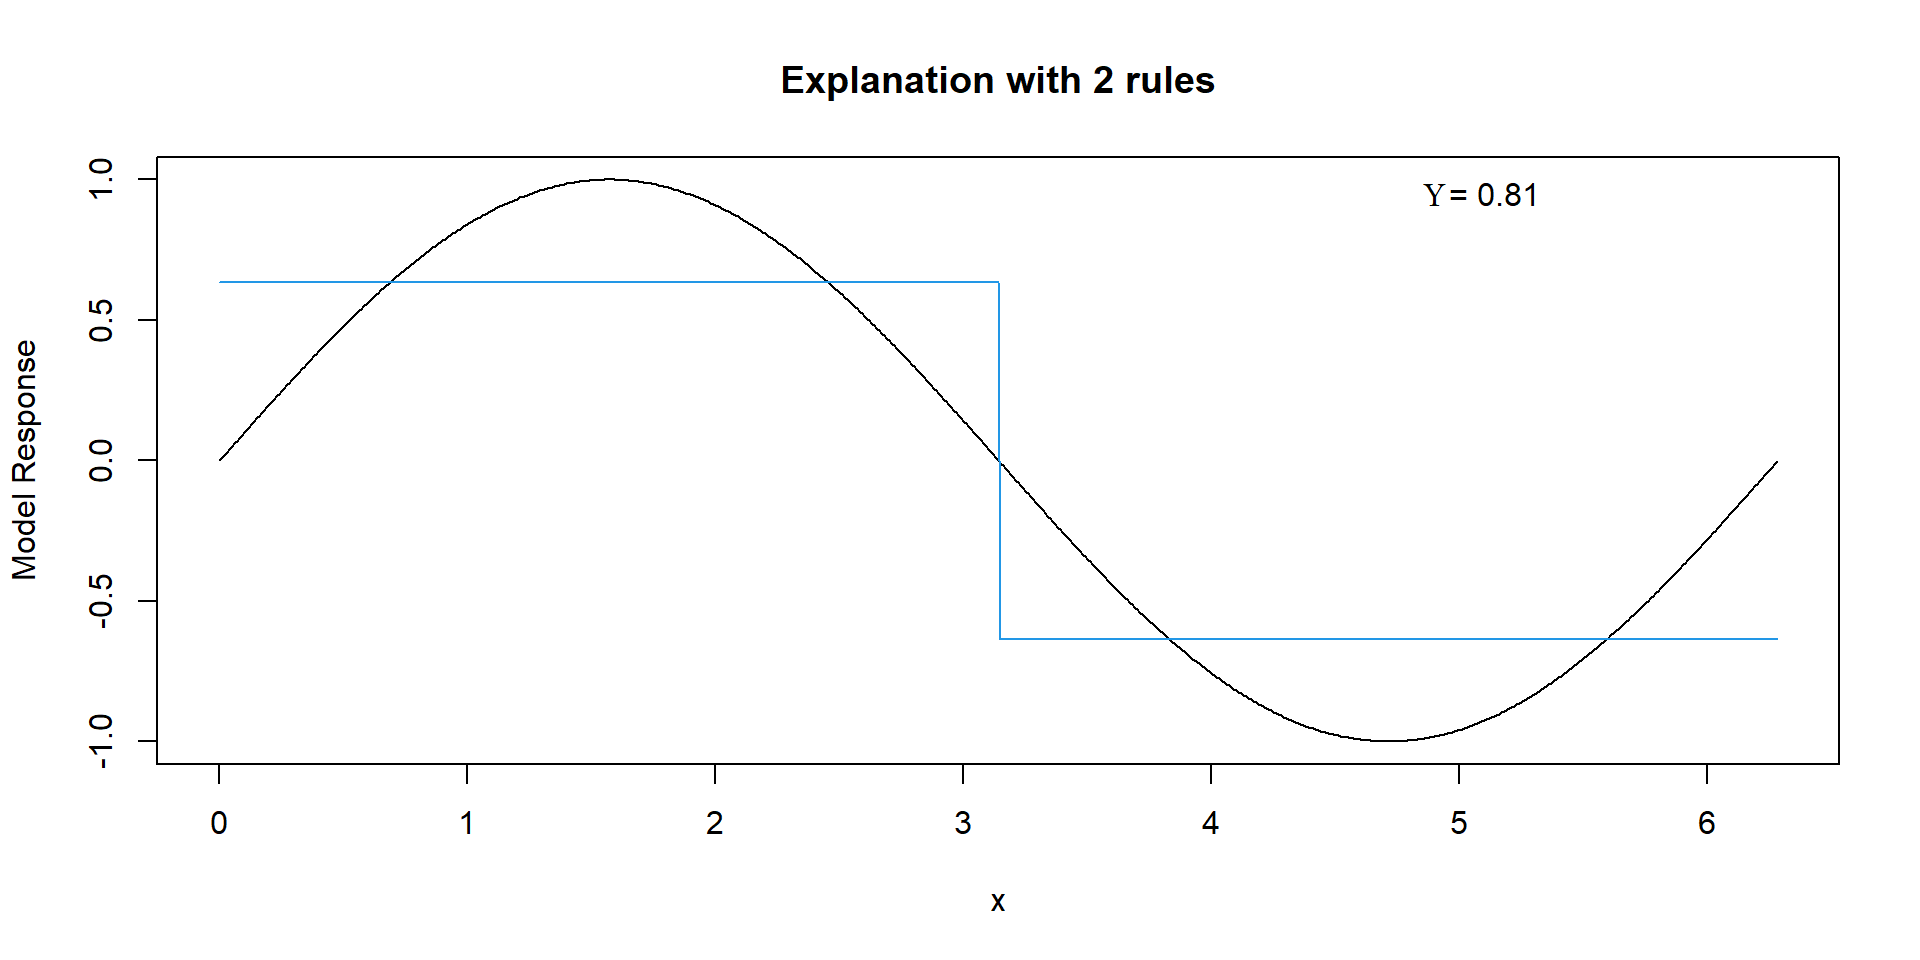
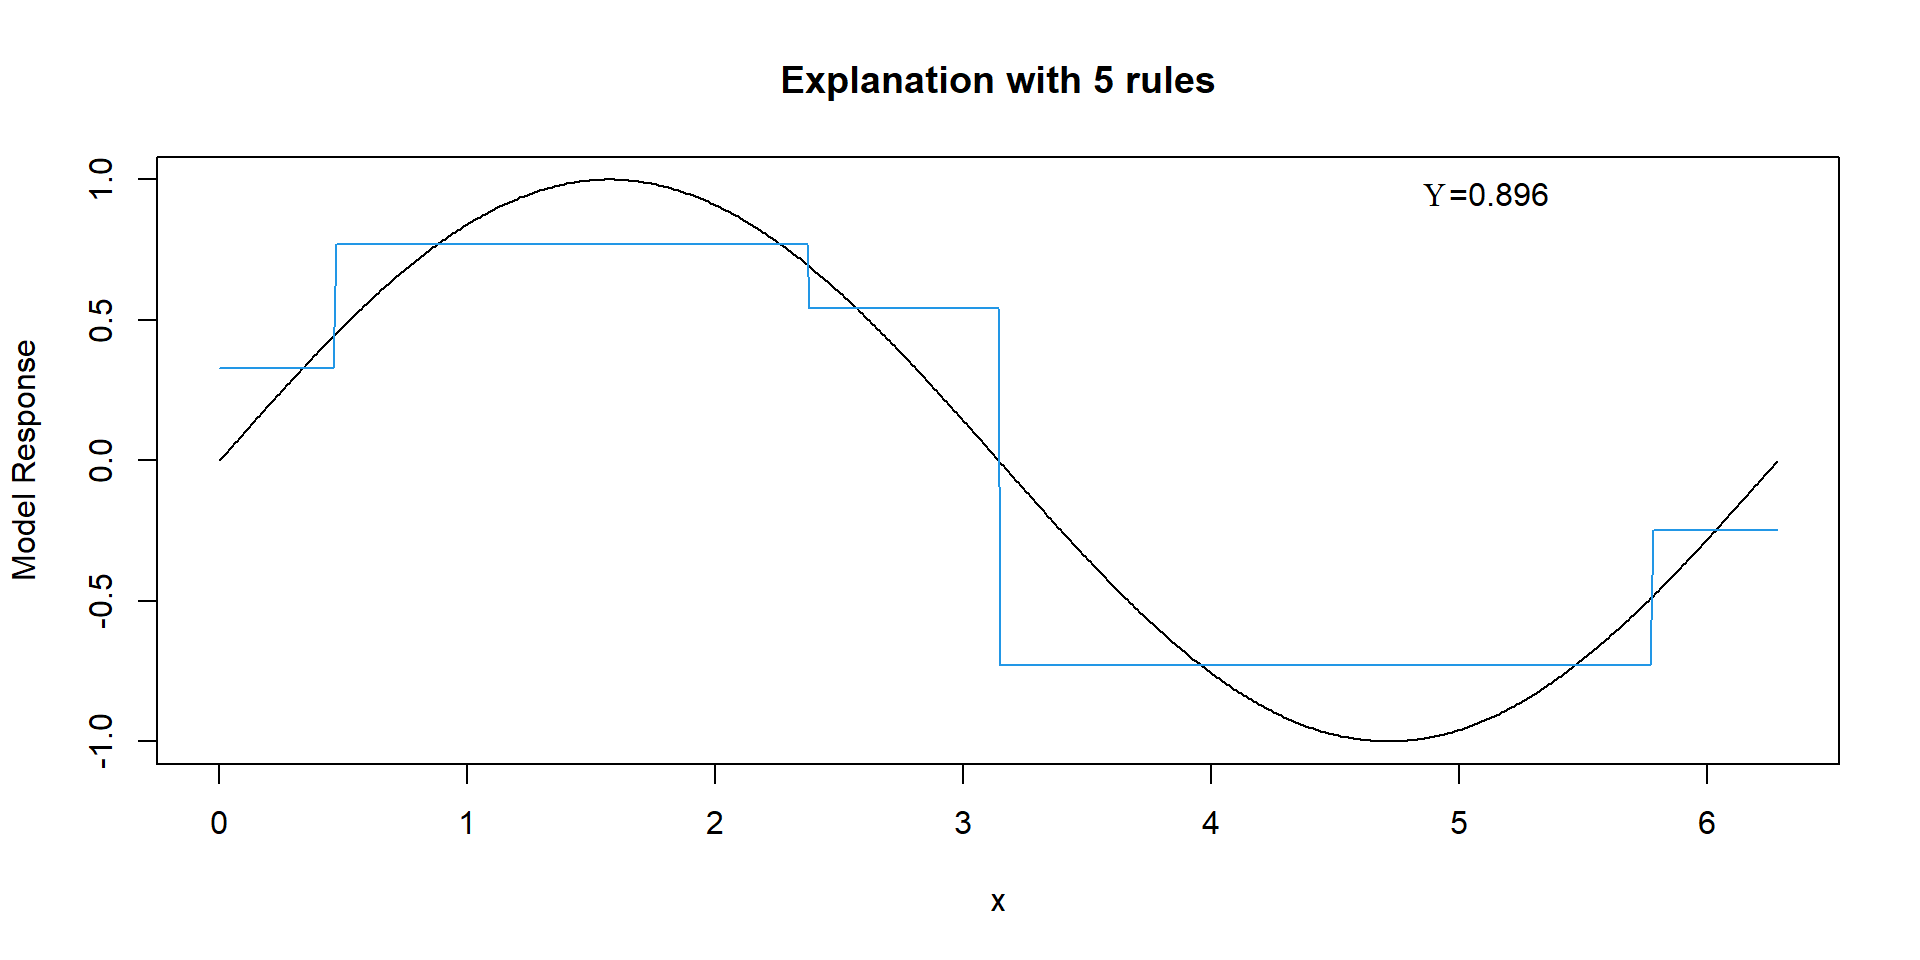
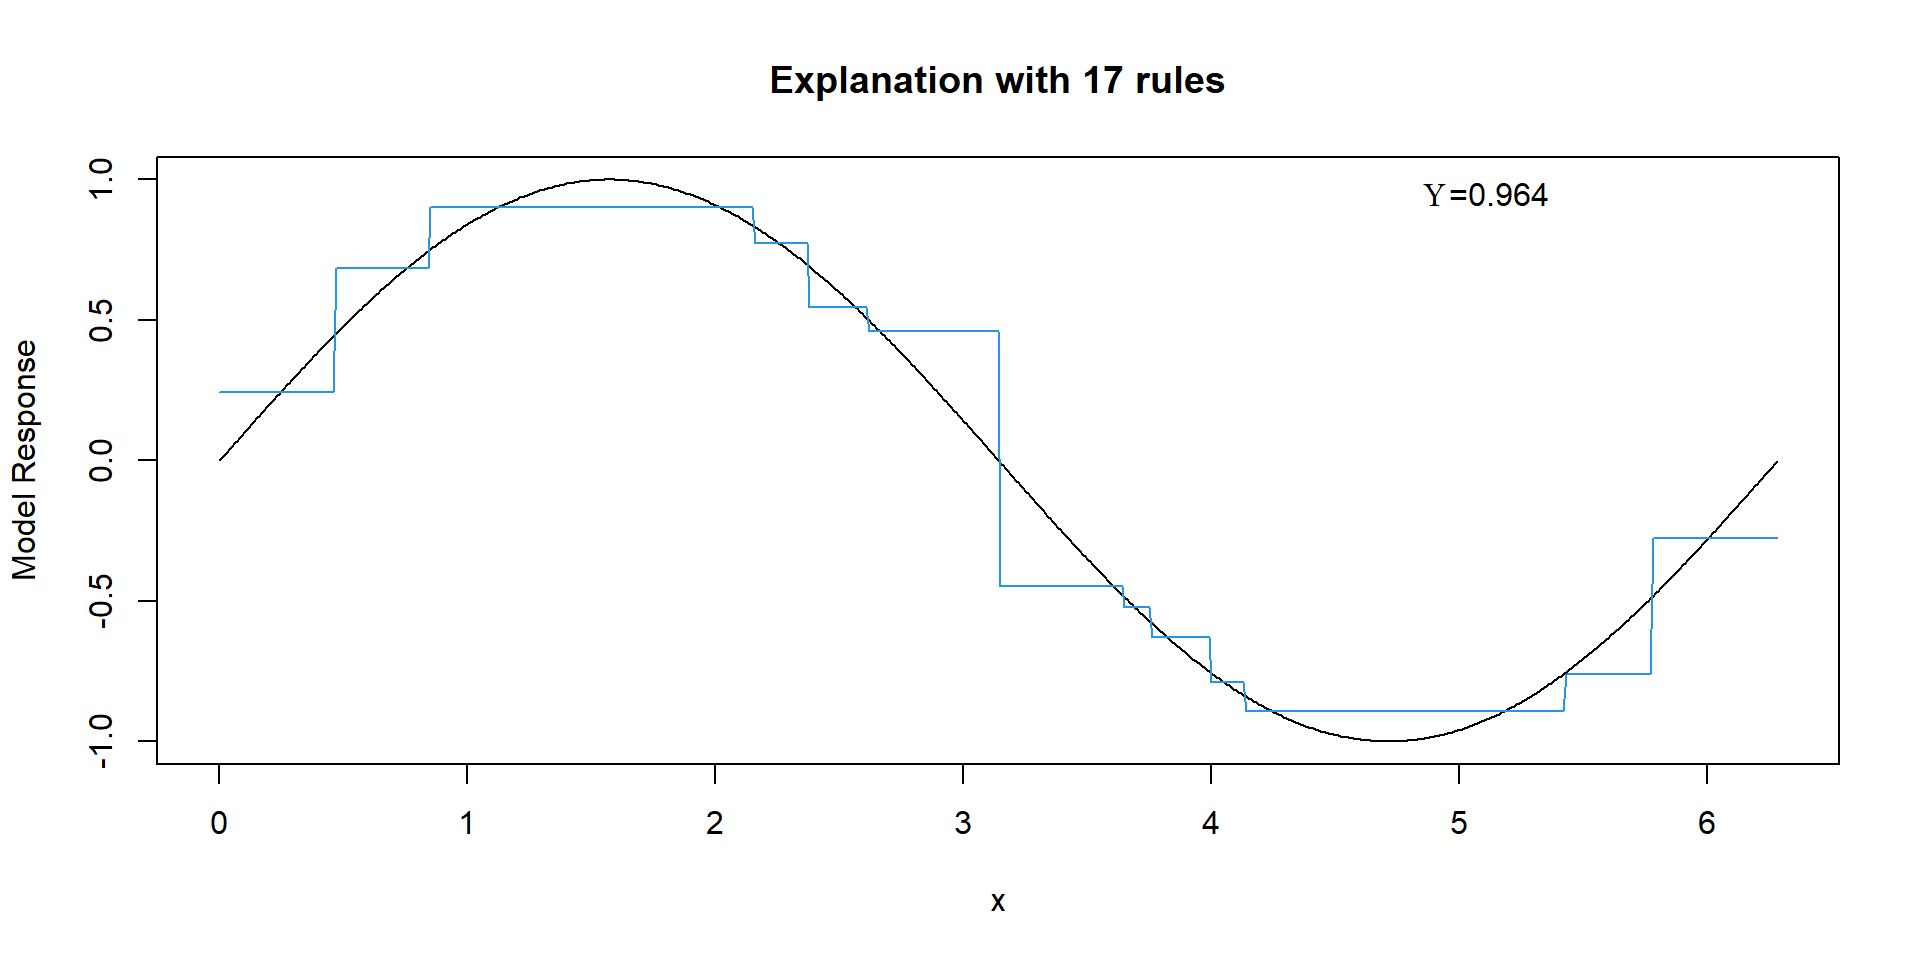
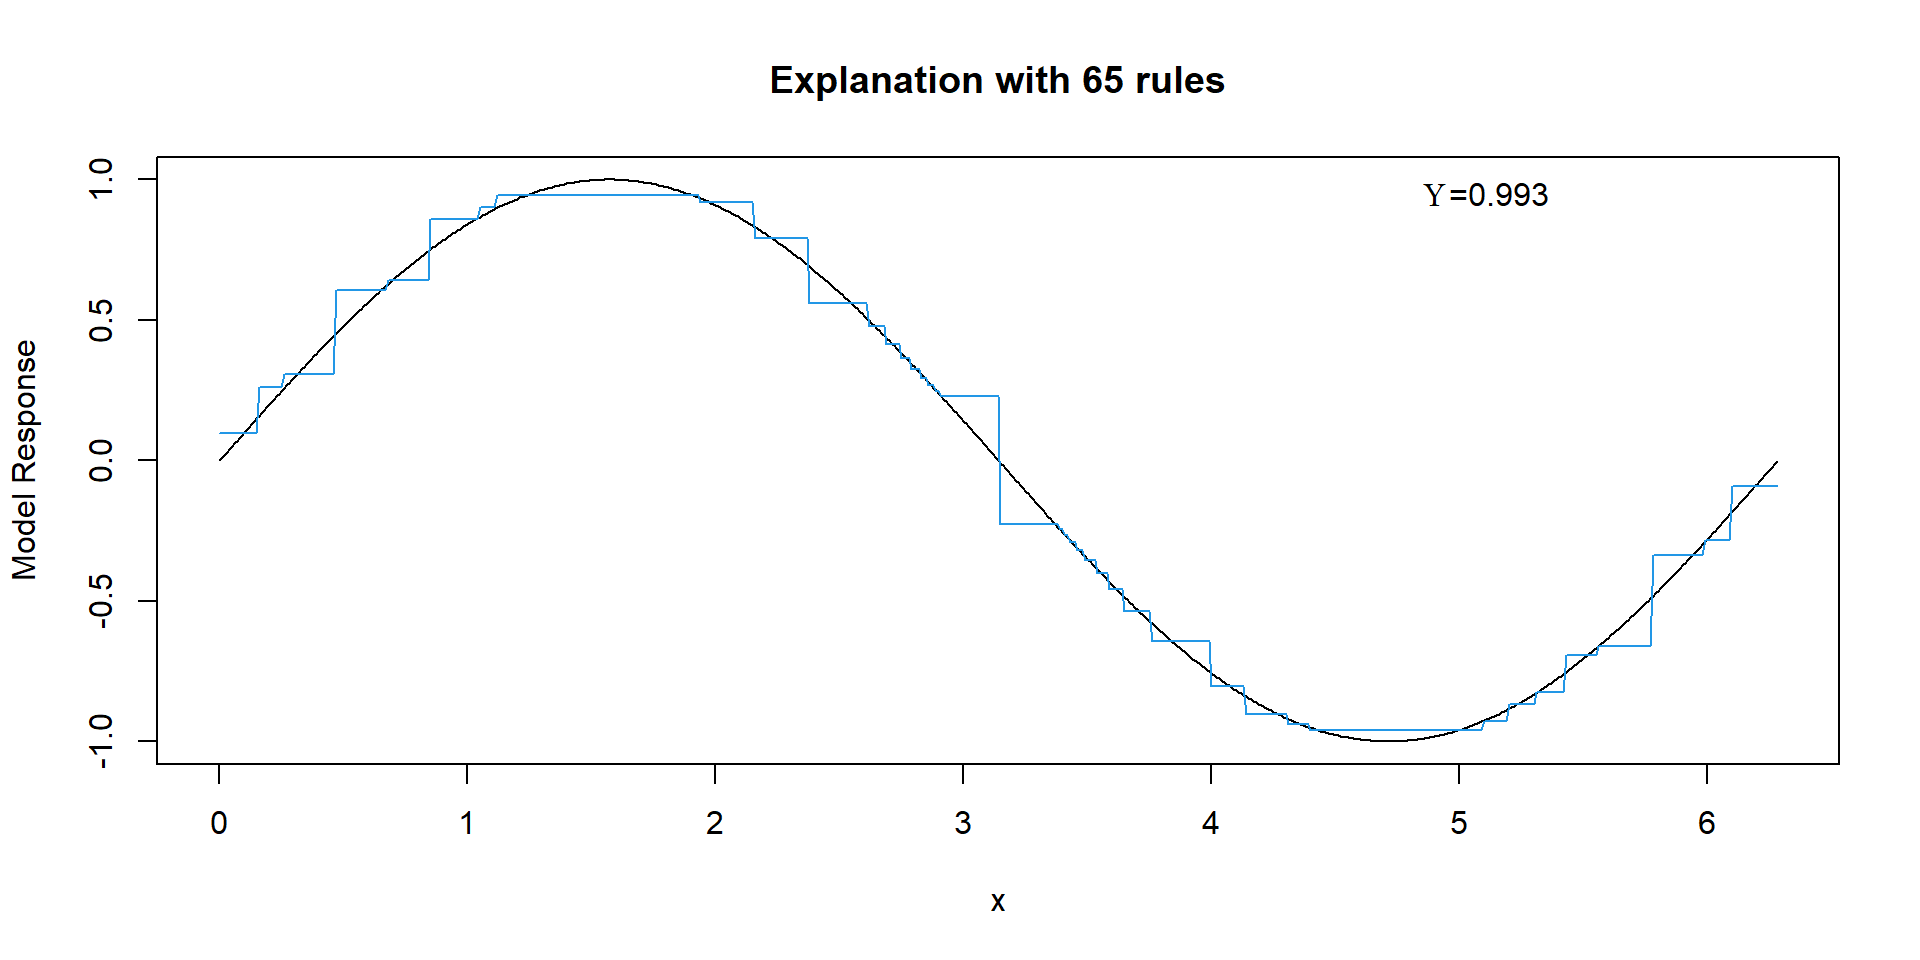
Gradient boosting (Friedman 2001) maximizes explainability within each step…
…using tree stumps adds one single rule per iteration.
Result: a set of interpretable rules…
…where number of rules can be controlled by the number of boosting iterations.
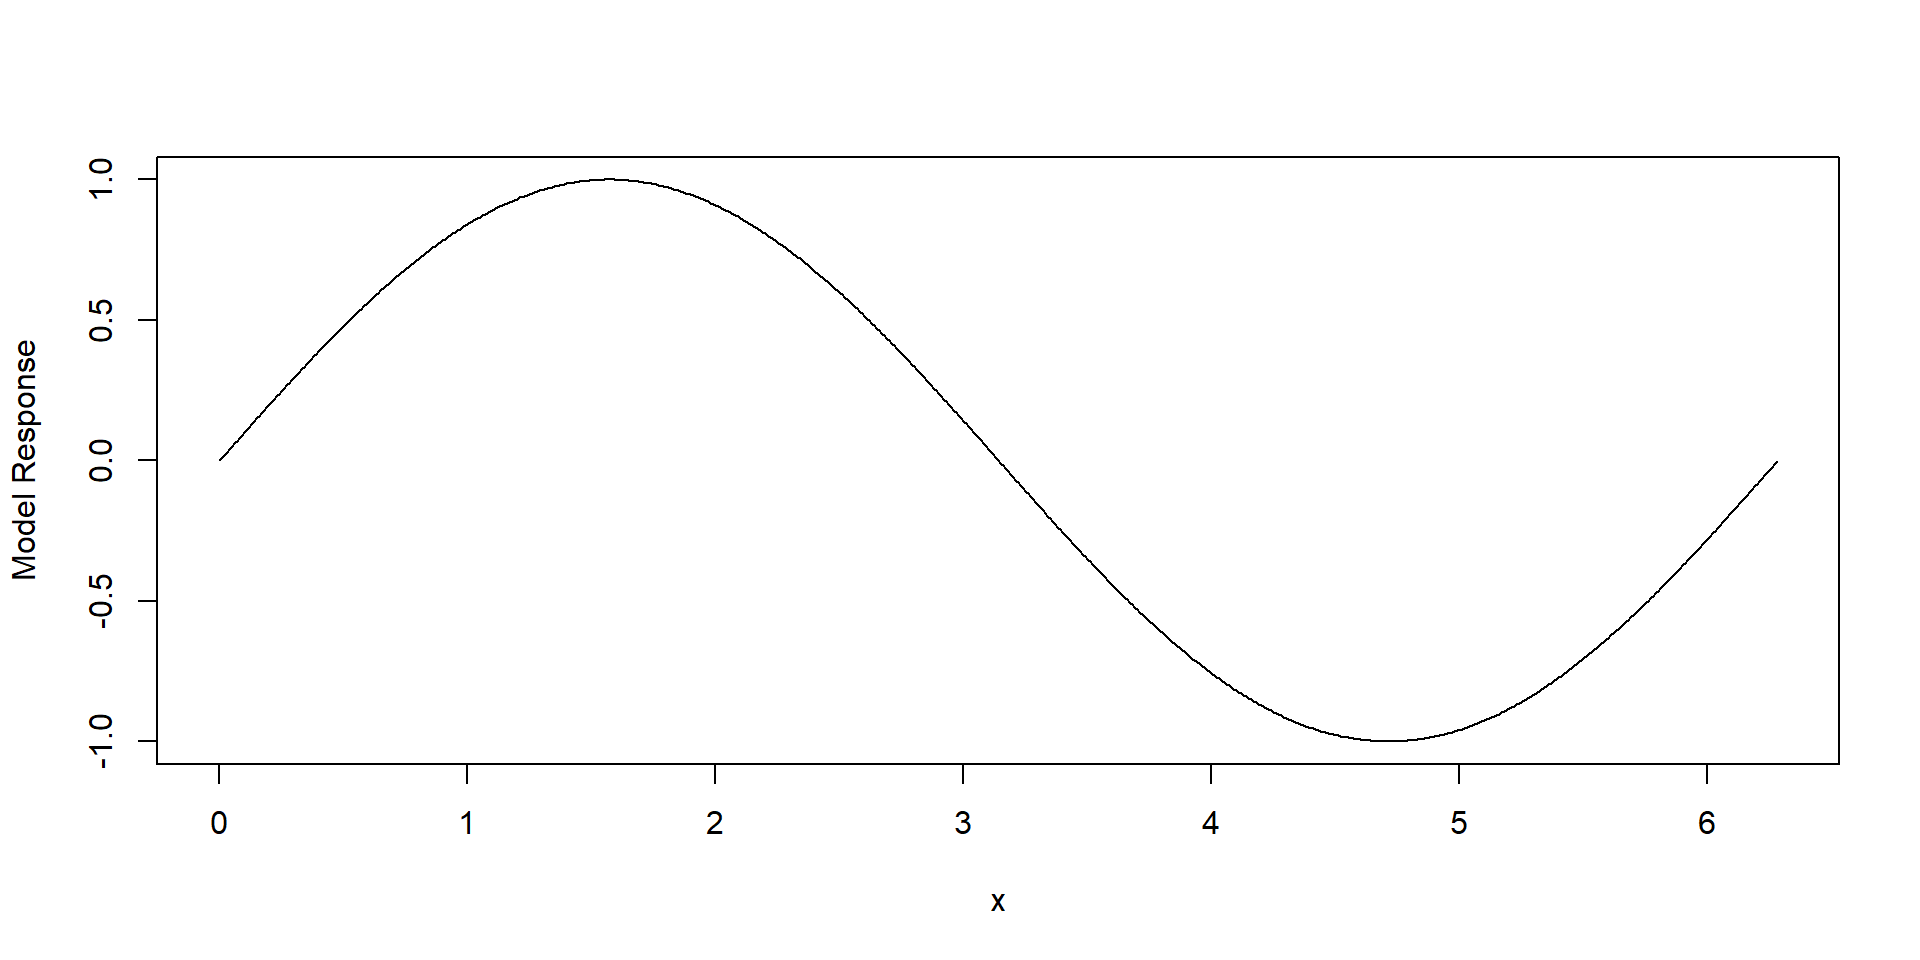
An Artificial Example
Explanation with 2 Rules
Explanation with 5 Rules
Explanation with 17 Rules
Explanation with 65 Rules
Code Demo on Boston Housing data
Rules to Explain the ranger model
| variable | upper_bound_left | levels_left | pleft | pright |
|---|---|---|---|---|
| Intercept | NA | NA | 22.32983 | 22.32983 |
| crim | 14.14345 | NA | 0.38880 | -5.04130 |
| dis | 1.35735 | NA | 5.24950 | -0.14660 |
| lon | -71.04785 | NA | 0.76220 | -0.91540 |
| lstat | 5.23000 | NA | 3.32010 | -0.49990 |
| lstat | 14.43500 | NA | 2.49010 | -4.76530 |
| rm | 6.81200 | NA | 0.76570 | -3.48240 |
| rm | 6.82500 | NA | -2.67310 | 12.36330 |
| rm | 7.43700 | NA | -0.26650 | 4.63890 |
Trade off
Summary
- Flexibility vs Interpretability
- Explanation Groves:
- extract set of explainable rules that maximize explainability \(\Upsilon\),
- at the same time control complexity of the explanation,
- analyze trade-off between complexity and adequacy of an explanation.
- (!) There does not necessarily exist an easy explanation of a complex model.
- Implementeted in the R package xgrove.
![]()
Available on CRAN.
Thank You!
Banerjee, Mousumi, Ying Ding, and Anne-Michelle Noone. 2012. “Identifying Representative Trees from Ensembles.” Stat Med 31 (15): 1601–16. https://doi.org/10.1002/sim.4492.
Bücker, Michael, Gero Szepannek, Alicja Gosiewska, and Przemyslaw Biecek. 2021. “TAX4CS – Transparency, Auditability and eXplainability of Machine Learning Models in Credit Scoring.” Journal of the Operational Research Society, 1–21. https://doi.org/10.1080/01605682.2021.1922098.
Cowan, Nelson. 2010. “The Magical Mystery Four: How Is Working Memory Capacity Limited, and Why?” Curr Dir Psychol Sci 19 (1): 51–57. https://doi.org/10.1177/0963721409359277.
European Commission. 2024. “EU Artificial Intelligence Act.” https://artificialintelligenceact.eu/the-act/.
Fernández-Delgado, Manuel, Eva Cernadas, Senén Barro, and Dinani Amorim. 2014. “Do We Need Hundreds of Classifiers to Solve Real World Classification Problems?” J. Mach. Learn. Res. 15 (1): 3133–81.
Friedman, Jerome. 2001. “Greedy Function Approximation: A Gradient Boosting Machine.” Annals of Statistics 29: 1189–1232.
Gosiewska, Alicja, and Przemyslaw Biecek. 2019. “Do Not Trust Additive Explanationss.” https://arxiv.org/pdf/1903.11420.
Harrison, D., and D. L. Rubinfeld. 1978. “Hedonic Prices and the Demand for Clean Air.” J. Of Environmental Economics and Managemen 5: 81–102.
James, Gareth, Daniela Witten, Trevor Hastie, and Robert Tibshirani. 2019. An Introduction to Statistical Learning. Second Edition. Springer.
Miller, George. 1956. “The Magical Number Seven, Plus or Minus Two: Some Limits on Our Capacity for Processing Information.” Psychological Review 63 (2): 81–97. https://doi.org/10.1037/h0043158.
Molnar, Christoph. 2022. Interpretable Machine Learning: A Guide for Making Black Box Models Explainable. 2nd ed. https://christophm.github.io/interpretable-ml-book.
Molnar, Christoph, Gunnar König, Julia Herbinger, Timo Freiesleben, Susanne Dandl, Christian A. Scholbeck, Giuseppe Casalicchio, Moritz Grosse-Wentrup, and Bernd Bischl. 2022. “General Pitfalls of Model-Agnostic Interpretation Methods for Machine Learning Models.” In xxAI - Beyond Explainable AI: Int. Workshop at ICML 2020, edited by Andreas Holzinger, Randy Goebel, Ruth Fong, Taesup Moon, Klaus-Robert Müller, and Wojciech Samek. Springer. https://doi.org/10.1007/978-3-031-04083-2_4.
Probst, Philipp, Anne-Laure Boulesteix, and Bernd Bischl. 2021. “Tunability: Importance of Hyperparameters of Machine Learning Algorithms.” J. Mach. Learn. Res. 20 (1): 1934–65.
Rudin, Cynthia. 2019. Stop Explaining Black Box Machine Learning Models for High Stakes Decisions and Use Interpretable Models Instead. https://arxiv.org/abs/1811.10154.
Szepannek, Gero. 2017. “On the Practical Relevance of Modern Machine Learning Algorithms for Credit Scoring Applications.” WIAS Report Series 29: 88–96. https://doi.org/10.20347/wias.report.29.
Szepannek, Gero, and Karsten Lübke. 2022. “Explaining Artificial Intelligence with Care.” KI - Künstliche Intelligenz. https://doi.org/10.1007/s13218-022-00764-8.
———. 2023. “How Much Do We See? On the Explainability of Partial Dependence Plots for Credit Risk Scoring.” Argumenta Oeconomica 50. https://doi.org/10.15611/aoe.2023.1.07.
Therneau, Terry M., and Elizabeth J. Atkinson. 2015. “An Introduction to Recursive Partitioning Using the RPART Routines.” In. https://www.biostat.wisc.edu/~kbroman/teaching/statgen/2004/refs/therneau.pdf.
Woźnica, Katarzyna, Katarzyna Pękala, Hubert Baniecki, Wojciech Kretowicz, Elżbieta Sienkiewicz, and Przemysław Biecek. 2021. “Do Not Explain Without Context: Addressing the Blind Spot of Model Explanations.” https://arxiv.org/pdf/2105.13787.
Wright, Marvin N., and Andreas Ziegler. 2017. “Ranger: A Fast Implementation of Random Forests for High Dimensional Data in c++ and r.” Journal of Statistical Software 77 (1): 1–17. https://doi.org/10.18637/jss.v077.i01.